End-to-End Tracing for Multi-Step AI Pipelines
How to build observability into complex AI pipelines — distributed tracing, cost attribution, quality monitoring, and debugging production failures.

A single user query in a RAG system touches an embedding model, a vector database, a reranker, and an LLM. When something goes wrong — and it will — you need to trace the entire chain. Traditional APM tools don't understand AI-specific signals. Here's how to build observability that does.
The observability gap
Standard distributed tracing (Jaeger, Datadog APM) captures HTTP calls and database queries. But AI pipelines have unique signals that traditional tools miss:
- Token consumption per step
- Model confidence and uncertainty signals
- Retrieval quality (were the right documents found?)
- Prompt/completion pairs for debugging
- Cost attribution per request
Without these, debugging a hallucination or quality regression is impossible.
Architecture: The tracing layer
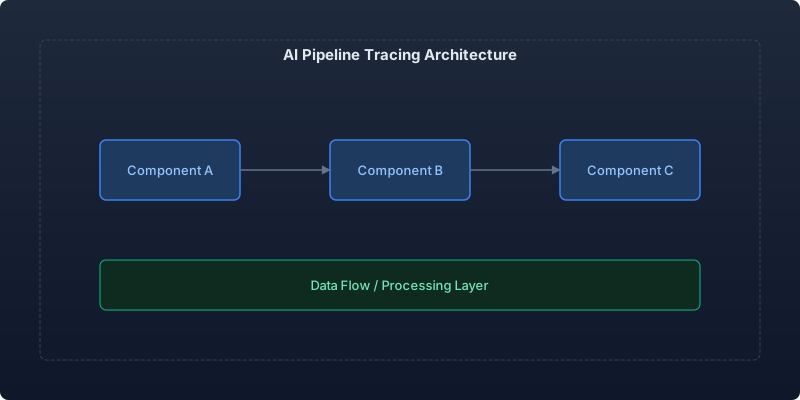
The tracing system wraps every AI operation in a span that captures both standard metrics (latency, status) and AI-specific metadata (tokens, model, cost).
from dataclasses import dataclass, field
from contextlib import asynccontextmanager
from typing import Any
import time
import uuid

@dataclass
class AISpan:
    span_id: str = field(default_factory=lambda: str(uuid.uuid4()))
    trace_id: str = ""
    parent_id: str | None = None
    operation: str = ""
    model: str | None = None
    input_tokens: int = 0
    output_tokens: int = 0
    cost_usd: float = 0.0
    latency_ms: float = 0.0
    metadata: dict[str, Any] = field(default_factory=dict)
    status: str = "ok"
    error: str | None = None

class AITracer:
    def __init__(self, exporter):
        self.exporter = exporter
        self._active_traces: dict[str, list[AISpan]] = {}

    @asynccontextmanager
    async def trace(self, trace_id: str, operation: str, **kwargs):
        span = AISpan(
            trace_id=trace_id,
            operation=operation,
            **kwargs
        )
        start = time.perf_counter()
        try:
            yield span
            span.status = "ok"
        except Exception as e:
            span.status = "error"
            span.error = str(e)
            raise
        finally:
            span.latency_ms = (time.perf_counter() - start) * 1000
            await self.exporter.export(span)
            self._active_traces.setdefault(trace_id, []).append(span)

    def get_trace_summary(self, trace_id: str) -> dict:
        spans = self._active_traces.get(trace_id, [])
        return {
            "total_latency_ms": sum(s.latency_ms for s in spans),
            "total_tokens": sum(s.input_tokens + s.output_tokens for s in spans),
            "total_cost_usd": sum(s.cost_usd for s in spans),
            "steps": len(spans),
            "errors": [s.error for s in spans if s.error],
        }
Instrumenting a RAG pipeline
Here's how tracing wraps a complete retrieval-augmented generation flow:
import { randomUUID } from "crypto";

interface TraceSpan {
  spanId: string;
  traceId: string;
  operation: string;
  startTime: number;
  endTime?: number;
  metadata: Record<string, unknown>;
  children: TraceSpan[];
}

class PipelineTracer {
  private spans: Map<string, TraceSpan> = new Map();

  startSpan(traceId: string, operation: string, metadata: Record<string, unknown> = {}): TraceSpan {
    const span: TraceSpan = {
      spanId: randomUUID(),
      traceId,
      operation,
      startTime: performance.now(),
      metadata,
      children: [],
    };
    this.spans.set(span.spanId, span);
    return span;
  }

  endSpan(span: TraceSpan, result: Record<string, unknown> = {}): void {
    span.endTime = performance.now();
    span.metadata = { ...span.metadata, ...result };
  }

  getTrace(traceId: string): TraceSpan[] {
    return [...this.spans.values()].filter((s) => s.traceId === traceId);
  }
}

// Usage in a RAG pipeline
async function ragPipeline(query: string): Promise<string> {
  const tracer = new PipelineTracer();
  const traceId = randomUUID();

  // Step 1: Embed query
  const embedSpan = tracer.startSpan(traceId, "embed_query", { model: "text-embedding-3-small" });
  const queryVector = await embedQuery(query);
  tracer.endSpan(embedSpan, { dimensions: queryVector.length, latencyMs: embedSpan.endTime! - embedSpan.startTime });

  // Step 2: Vector search
  const searchSpan = tracer.startSpan(traceId, "vector_search", { topK: 10 });
  const documents = await vectorSearch(queryVector, 10);
  tracer.endSpan(searchSpan, { resultsCount: documents.length, maxScore: documents[0]?.score });

  // Step 3: Rerank
  const rerankSpan = tracer.startSpan(traceId, "rerank", { model: "rerank-v3" });
  const reranked = await rerank(query, documents);
  tracer.endSpan(rerankSpan, { kept: reranked.length });

  // Step 4: Generate
  const genSpan = tracer.startSpan(traceId, "generate", { model: "claude-sonnet-4-20250514" });
  const response = await generate(query, reranked);
  tracer.endSpan(genSpan, { inputTokens: response.usage.input, outputTokens: response.usage.output });

  return response.text;
}
Cost attribution
Every trace accumulates cost across steps. This lets you answer: "How much does it cost to serve one user query?"
| Pipeline Step | Avg Cost/Request | % of Total |
|---|---|---|
| Query embedding | $0.000003 | 0.2% |
| Vector search | $0.000010 | 0.7% |
| Reranking | $0.000200 | 13.8% |
| LLM generation | $0.001230 | 85.3% |
| Total | $0.001443 | 100% |
Generation dominates. But knowing the breakdown lets you optimize strategically — caching the generation step yields 85% savings on cache hits.
Quality signals in traces
Beyond latency and cost, trace AI-specific quality signals:
Retrieval quality metrics
- Relevance score distribution — are retrieved documents consistently relevant?
- Score gap — difference between #1 and #10 result (large gap = high confidence)
- Empty results rate — queries that return no relevant documents
Generation quality signals
- Output length variance — sudden changes suggest prompt or model issues
- Refusal rate — model declining to answer
- Confidence markers — hedging language ("I'm not sure", "possibly")
Alerting on AI-specific signals
from dataclasses import dataclass

@dataclass
class AlertRule:
    metric: str
    threshold: float
    window_minutes: int
    severity: str

ALERT_RULES = [
    AlertRule("retrieval.empty_rate", 0.15, 5, "warning"),
    AlertRule("retrieval.avg_score", 0.5, 10, "critical"),
    AlertRule("generation.refusal_rate", 0.05, 5, "warning"),
    AlertRule("generation.avg_latency_ms", 5000, 5, "critical"),
    AlertRule("pipeline.cost_per_request", 0.01, 15, "warning"),
    AlertRule("pipeline.error_rate", 0.02, 5, "critical"),
]
The debugging workflow
When a user reports a bad answer:
- Find the trace by request ID or timestamp
- Check retrieval — were relevant documents found? Low scores suggest embedding or indexing issues
- Check reranking — did reranking change order significantly? If not, the retrieval was either great or the reranker failed
- Check generation — examine the exact prompt + context sent to the LLM
- Compare to similar queries — is this an isolated failure or a pattern?
This workflow takes 2 minutes with good tracing. Without it, debugging a single bad answer can take hours.
Tools and implementation options
| Tool | Best For | AI-Native Features |
|---|---|---|
| Langfuse | Open-source tracing | Prompt management, evals, cost |
| Helicone | API proxy approach | Zero-code, cost tracking |
| Weights & Biases | ML teams | Experiment tracking, evals |
| Custom (OpenTelemetry) | Full control | Whatever you build |
For most teams, start with Langfuse or Helicone. Build custom only when you need tight integration with your deployment pipeline.
Key takeaways
- Traditional APM misses AI-specific signals — token counts, retrieval quality, and cost attribution need dedicated instrumentation
- Trace the full pipeline, not just the LLM call — retrieval failures are more common than generation failures
- Cost attribution per request enables ROI decisions on caching and model selection
- Alert on quality signals (retrieval scores, refusal rates), not just latency and errors
- Good tracing turns a 2-hour debugging session into a 2-minute investigation
Observability isn't optional for production AI. It's how you maintain quality as your pipeline evolves and scales.
Recommended reading
The State of Agentic AI in 2026: Capabilities, Limitations, and Production Readiness
Comprehensive analysis of agentic AI in 2026 covering production capabilities, current limitations, and enterprise readiness benchmarks with real deployment data.
Observability for AI Agents: Tracing Multi-Step Reasoning Chains in Production
How to implement production observability for AI agents including distributed tracing, reasoning chain analysis, and debugging multi-step failures.
Measuring and Reducing AI Workload Carbon Emissions: A Practical Engineering Guide
Building a carbon-aware scheduling system for ML training and inference workloads that reduced our AI infrastructure emissions by 42% while maintaining SLA commitments.



Comments
No comments yet. Be the first to share your thoughts.