Translating Engineering Metrics for Non-Technical Board Members
A CTO guide to presenting engineering health, velocity, and risk in language that resonates with board members who think in revenue, not repositories.

The first time I presented to a board, I showed deployment frequency charts and talked about microservice decomposition. The lead investor's eyes glazed over within 90 seconds. After the meeting, our CEO pulled me aside: "They don't care about your architecture. They care about whether we can ship fast enough to win the market."
That was the most important lesson of my career as a CTO. Board communication isn't about dumbing things down—it's about translating engineering reality into business language. The board needs to make investment decisions based on your team's capability. Your job is to give them the signal they need without the noise they don't.
The Translation Problem
Engineering metrics exist to help engineers improve. Board metrics exist to help investors assess risk and opportunity. These are fundamentally different audiences with different decision frameworks.
| Engineering Metric | What Engineers Hear | What the Board Needs to Hear |
|---|---|---|
| Deployment frequency: 25/day | "We ship fast" | "We can respond to market changes in hours, not weeks" |
| 99.95% uptime | "Our infrastructure is solid" | "We lost $18K in revenue from downtime this quarter—down from $74K last quarter" |
| Tech debt: 30% of backlog | "We need a refactoring sprint" | "Without $200K investment in platform health, feature velocity drops 40% in 6 months" |
| Cycle time: 3.2 days | "We're efficient" | "From decision to customer impact takes 3 days—competitors average 14" |
The right column doesn't simplify—it reframes. It answers the question every board member is actually asking: "Are we building a competitive advantage or accumulating risk?"
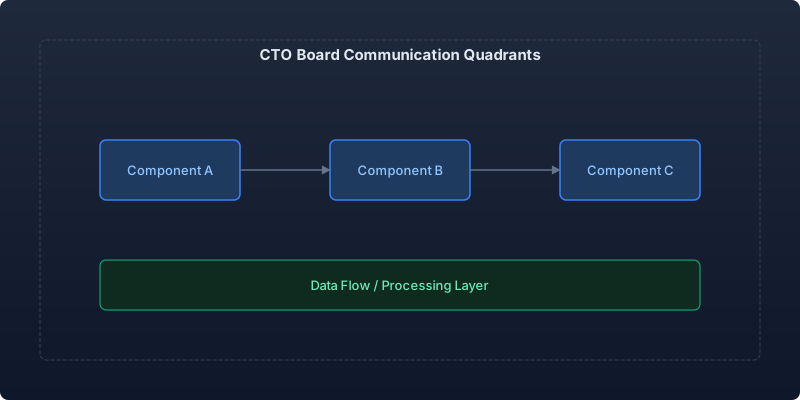
The Four Quadrants Framework
I structure every board presentation around four quadrants that map to what boards actually care about:
Quadrant 1: Velocity (Can We Win?)
This answers: "Are we shipping fast enough to capture the market opportunity?"
Metrics to present:
- Time from product decision to customer availability
- Feature throughput trend (features shipped per quarter, trending up or down)
- Competitive shipping speed comparison (if available)
How to present it:
Don't say: "Our cycle time is 3.2 days with a p95 of 8 days."
Say: "We shipped 14 customer-facing features this quarter, up from 9 last quarter. Our fastest competitor shipped 6. At current velocity, we'll complete the product roadmap 4 months ahead of our Series B timeline."
Visual: A simple trend line of features shipped per quarter with a projection line showing roadmap completion date.
Quadrant 2: Reliability (Can We Keep It?)
This answers: "Will our customers stay, and can we handle growth?"
Metrics to present:
- Revenue-weighted availability (not raw uptime percentage)
- Customer-impacting incidents per quarter (trending)
- Load headroom (how much growth we can handle without infrastructure investment)
How to present it:
Don't say: "We had 99.97% uptime and our p99 latency is 340ms."
Say: "Customer-impacting incidents dropped from 7 to 2 this quarter. We estimate $12K in prevented churn from reliability improvements. Our infrastructure can handle 3x current load without additional investment—we'll need to scale at $4M ARR, projected for Q3."
Visual: Incident count bar chart with revenue impact annotations.
Quadrant 3: Efficiency (Are We Spending Well?)
This answers: "Is engineering investment generating proportional output?"
Metrics to present:
- Engineering cost per feature (total eng spend / features shipped)
- Infrastructure cost as percentage of revenue (trending)
- Revenue per engineer (for comparison against industry benchmarks)
How to present it:
Don't say: "We reduced our AWS bill by 23% through right-sizing and Reserved Instances."
Say: "Infrastructure costs grew 12% while revenue grew 45%—meaning our cost-per-dollar-of-revenue dropped from $0.18 to $0.14. At our growth rate, this efficiency saves $340K by year-end versus linear scaling."
Visual: Dual-axis chart showing revenue growth vs infrastructure cost growth, with the widening gap highlighted.
| Stage | Infra as % of Revenue (Healthy) | Engineering Cost per Feature |
|---|---|---|
| Pre-seed to Seed | 15-25% | Not relevant yet |
| Series A | 10-18% | $45K-$80K |
| Series B | 6-12% | $30K-$55K |
| Series C+ | 3-8% | $25K-$45K |
Quadrant 4: Risk (What Could Go Wrong?)
This answers: "What are the engineering risks to our business plan?"
Metrics to present:
- Key person dependencies (bus factor for critical systems)
- Technical debt trajectory (in dollar terms—see my DICE framework)
- Security posture summary (compliance status, vulnerability trends)
- Hiring pipeline health (open roles, time-to-fill, acceptance rate)
How to present it:
Don't say: "We have significant technical debt in the payment processing module and need to address our monolithic architecture."
Say: "Two systems carry single-person dependency risk—if either engineer left, those systems would take 3 months to recover. We've started cross-training and documentation this quarter, reducing recovery time to 3 weeks by Q2. The payment system needs a $180K rewrite to support the multi-currency feature on our Series B roadmap—I recommend starting in Q1."
The Board Update Template
Here's the exact template I use for board deck slides. It fits on 2-3 slides maximum:
Slide 1: Engineering Scorecard
A single table with 6-8 metrics, each showing:
- Current value
- Trend direction (arrow up/down/flat)
- Status (green/yellow/red)
- One-sentence context
Example:
| Metric | Current | Trend | Status | Context |
|---|---|---|---|---|
| Features shipped | 14 | Up from 9 | Green | Ahead of roadmap pace |
| Revenue availability | 99.98% | Stable | Green | $4K revenue impact this quarter |
| Infra cost / revenue | 11.2% | Improving | Green | Down from 14.8% last quarter |
| Eng cost per feature | $52K | Improving | Yellow | Target: $45K by Q3 |
| Open critical roles | 3 | Flat | Yellow | Sr. Backend, 2x ML Engineers |
| Tech debt investment | $140K | Planned | Green | Targeting payment rewrite |
Slide 2: Key Decisions Needed
Every board presentation should include 1-2 decisions you need from the board. This makes the engineering section actionable, not just informational.
Examples:
- "Recommend approving $180K budget for payment system rewrite. ROI: enables multi-currency revenue ($2M ARR potential) 4 months sooner."
- "Requesting headcount approval for 2 additional ML engineers. Without them, the personalization roadmap slips from Q2 to Q4."
Slide 3: Forward-Looking Risks (Optional)
Only include this if there's a material risk the board should be aware of. Don't create anxiety unnecessarily.
Communication Anti-Patterns
The Data Dump
Showing 30 metrics because you can. The board can absorb 6-8 data points in a 10-minute engineering section. Pick the ones that tell a story.
The Apology Tour
"We had some challenges this quarter with reliability..." Stop. Frame problems as investments: "We identified a reliability gap that was costing $X/month. Here's our plan to resolve it by date Y."
The Technical Deep Dive
Resist the urge to explain how you solved something technically. The board cares about the business outcome, not the implementation. Save the technical narrative for your engineering blog.
The "Everything Is Fine" Report
If everything is always green, you're either not being honest or not measuring the right things. A board that never sees yellow or red metrics doesn't trust the CTO's reporting. Show vulnerability—it builds credibility.
Handling Board Questions
Board members typically ask three types of questions:
Comparison questions: "How does our velocity compare to [competitor/industry]?" Have benchmarks ready. I keep a mental database of industry averages for our stage and sector.
Risk questions: "What happens if [key person] leaves?" or "Can we handle [10x growth] event?" Answer with specific mitigation steps and timelines, not reassurances.
Investment questions: "If we gave you $500K more, what would you do with it?" Always have an answer ready. Frame it as "X investment produces Y outcome by Z date."
Building Board Relationships
The best CTO-board relationships are built outside of board meetings:
- Monthly 1:1 with your lead technical investor (15-30 minutes). Discuss upcoming technical decisions and get early input.
- Quarterly architecture memo (1 page). Send between meetings. Covers strategic technical direction in plain language.
- Ad-hoc risk communication. If something breaks or a key hire falls through, communicate within 24 hours. Boards hate surprises.
Actionable Takeaways
- Frame every metric as a business outcome. Uptime is revenue. Speed is competitive advantage. Debt is future cost.
- Use the four quadrants (Velocity, Reliability, Efficiency, Risk) to structure your updates.
- Limit to 6-8 metrics per board meeting. Quality of signal beats quantity of data.
- Always include a decision ask. Make the engineering section actionable, not just informational.
- Build relationships between meetings. The formal presentation is for confirmation, not persuasion.
Your board doesn't need to understand Kubernetes. They need to understand whether your engineering organization is a competitive weapon or a liability. Show them which one it is—clearly, concisely, and in their language.
Recommended reading
The Legacy of Leadership: What Remains When You Leave
The thing people remember is not your architecture. It is not your processes. It is how you made them feel. Reflections on what actually endures from engineering leadership.
What 3 A.M. Incidents Taught Me That AWS Certifications Never Did
Twenty production incidents reviewed: why understanding beats fixing, what certifications actually train, and the habits that keep a team calm at 3 a.m.
An Engineering Leader's Sustainable Weekly Rhythm
A realistic weekly rhythm that balances strategy, people, and operational work — without burning out or losing yourself in back-to-back meetings.



Comments
No comments yet. Be the first to share your thoughts.