Engineering OKRs That Drive Outcomes, Not Just Output
Most engineering OKRs measure activity instead of impact. Here is how to write OKRs that connect engineering work to business results—with real examples and anti-patterns.

I've reviewed over 200 engineering OKRs across the companies I've led and advised. At least 80% of them are useless. They measure output (features shipped, tickets closed, uptime maintained) without connecting to outcomes (revenue generated, users retained, market position strengthened).
The result: engineering teams hit their OKRs every quarter while the company struggles to grow. The metrics are green, but the business impact is invisible. Leadership loses trust in engineering's ability to contribute to strategy, and engineers feel like their work doesn't matter.
The fix isn't better goal-setting templates. It's a fundamental shift in what engineering teams measure and why.
Why Engineering OKRs Fail
The Output Trap
Most engineering OKRs look like this:
- Objective: Improve platform reliability
- KR1: Achieve 99.95% uptime
- KR2: Reduce P1 incidents to <3 per quarter
- KR3: Deploy monitoring for all critical services
These sound reasonable. They're also worthless for strategic alignment. Why? Because they don't answer the question: "Why does this matter to the business?"
99.95% uptime is meaningless without context. If your uptime was 99.9% and that was costing you $5K/month in churn—is investing a full quarter of platform engineering time to save $15K/year a good use of resources? Probably not. But the OKR doesn't force that conversation.
The Feature Factory
The other common failure mode:
- Objective: Deliver Q1 product roadmap
- KR1: Ship feature A by Feb 15
- KR2: Ship feature B by March 1
- KR3: Ship feature C by March 15
This is a project plan disguised as an OKR. It measures delivery (did we ship?) without measuring impact (did it work?). Teams optimize for shipping speed and never circle back to ask whether the feature moved the metrics that matter.
The Outcome-Oriented Framework
Good engineering OKRs follow a three-layer structure:
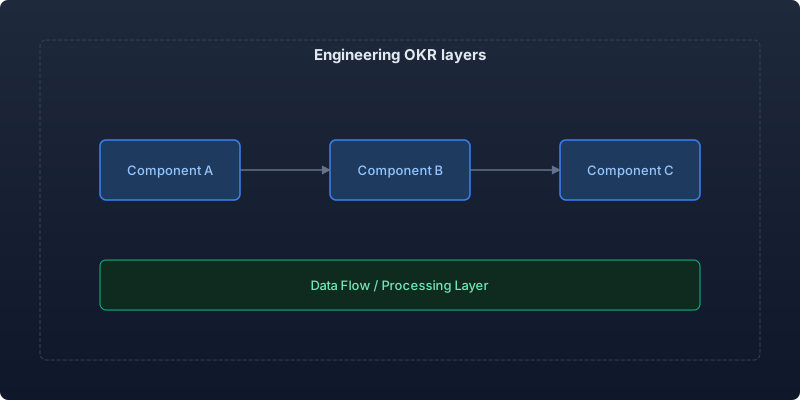
Layer 1: Business Outcome (The "Why")
Every engineering OKR must connect to a business outcome. Not vaguely—explicitly. If you can't draw a direct line from the OKR to revenue, retention, or market position, it's not strategic enough.
Layer 2: Engineering Lever (The "What")
Identify the specific engineering capability that drives the business outcome. This is where engineering expertise translates strategy into action.
Layer 3: Measurable Result (The "How Much")
Define the metric that proves the lever is working. This metric should be:
- Quantitative (a number, not a judgment)
- Time-bound (measurable within the quarter)
- Influenceable (the team can affect it through their work)
- Leading or concurrent (don't wait until next quarter to know if it worked)
Example OKRs That Work
Example 1: Platform Engineering
Bad OKR:
- Objective: Improve infrastructure reliability
- KR: Achieve 99.95% uptime
Good OKR:
- Objective: Eliminate reliability as a barrier to enterprise sales
- KR1: Reduce revenue-impacting incidents from 4/quarter to ≤1/quarter (enables enterprise SLA commitments)
- KR2: Achieve and document SOC 2 compliance for 3 pending enterprise deals worth $480K ARR
- KR3: Reduce MTTR from 42 minutes to <15 minutes (satisfies contractual SLA of 30-minute response)
Why it's better: Each KR connects to revenue. The team understands that reliability isn't an abstract goal—it directly enables $480K in enterprise pipeline.
Example 2: Product Engineering
Bad OKR:
- Objective: Ship search improvements
- KR: Launch new search algorithm by March 1
Good OKR:
- Objective: Increase user engagement through faster content discovery
- KR1: Reduce average search-to-action time from 34 seconds to <15 seconds
- KR2: Increase search result click-through rate from 23% to 40%
- KR3: Reduce "no results" rate from 18% to <8% (top user complaint in NPS feedback)
Why it's better: The team is measured on whether search actually improved for users, not whether they shipped a new algorithm. If the algorithm ships but CTR doesn't improve, the OKR correctly signals that more work is needed.
Example 3: Developer Experience / Internal Platform
Bad OKR:
- Objective: Improve developer productivity
- KR: Reduce CI build time by 50%
Good OKR:
- Objective: Accelerate time-to-production for all engineering teams
- KR1: Reduce median cycle time (commit → production) from 4.2 days to <2 days
- KR2: Increase deployment frequency from 8/day to 20+/day across all teams
- KR3: Reduce "blocked by infrastructure" mentions in retros from 12/month to <3/month
Why it's better: The DevEx team is measured on engineering team throughput, not just their own deliverables. If they reduce build time but cycle time doesn't improve (because the bottleneck was elsewhere), the OKR surfaces that misallocation.
Example 4: Data Engineering
Bad OKR:
- Objective: Build real-time analytics pipeline
- KR: Migrate 5 batch jobs to streaming
Good OKR:
- Objective: Enable data-driven product decisions with sub-hour feedback loops
- KR1: Product team can measure feature impact within 1 hour of launch (currently 24-48 hours)
- KR2: Reduce "we don't have data for that" responses to product questions from 8/month to ≤2/month
- KR3: A/B test conclusion time reduced from 14 days to 5 days (enabling 3x more experiments per quarter)
Why it's better: The data team is measured on enabling faster product decisions, not on infrastructure migration. The business cares about experimentation velocity, not whether the pipeline is batch or streaming.
The OKR Calibration Table
Use this table to check if your KRs are at the right level:
| KR Quality | Signal | Example |
|---|---|---|
| Too easy (sandbag) | 90%+ confidence of hitting it without significant effort | "Maintain current uptime" |
| Good stretch | 60-70% confidence, requires focused execution | "Reduce cycle time from 4 days to 2 days" |
| Aspirational | 30-40% confidence, requires innovation or luck | "Achieve zero-downtime deployments for all services" |
| Unrealistic | <20% confidence, demoralizing | "Rebuild the entire platform in one quarter" |
A healthy OKR set has mostly "good stretch" KRs (60-70% of them) with 1-2 "aspirational" KRs that push thinking.
Setting OKRs: The Process
Step 1: Start With Business Context (Week 1 of Quarter Planning)
Before engineering writes any OKRs, the CTO should present:
- Company OKRs and the strategic narrative behind them
- Revenue targets and what needs to be true technically to achieve them
- Customer feedback themes and product priorities
- Technical risks that could derail business plans
Step 2: Team-Level Drafting (Week 1-2)
Each team drafts OKRs that answer: "What is our biggest contribution to the company's goals this quarter?"
Teams should draft 1-2 objectives with 2-4 KRs each. More than that dilutes focus.
Step 3: Cross-Team Alignment (Week 2)
Share drafts across teams. Look for:
- Dependencies: Does Team A's OKR depend on Team B's work?
- Conflicts: Are two teams pulling in opposite directions?
- Gaps: Is any critical business outcome missing from all team OKRs?
Step 4: Calibration (End of Week 2)
The CTO reviews all team OKRs for:
- Connection to business outcomes (Layer 1)
- Appropriate ambition level (60-70% confidence)
- Measurability within the quarter
- No KR that's purely a milestone ("ship X by date Y")
Step 5: Weekly Check-ins (Throughout Quarter)
Each KR should have a weekly confidence score (on track / at risk / off track). If a KR is "at risk" for 3+ consecutive weeks, escalate and reprioritize.
Anti-Patterns to Avoid
| Anti-Pattern | Why It's Harmful | Fix |
|---|---|---|
| Binary KRs ("Ship feature X") | No gradient of success, doesn't measure impact | Replace with outcome metric the feature should move |
| Maintenance KRs ("Keep uptime above X") | Maintenance is table stakes, not an objective | Only make reliability a KR if you're actively investing to improve it |
| Too many KRs (>4 per objective) | Dilutes focus, creates excuse for partial delivery | Ruthlessly cut to 2-3 KRs that matter most |
| Individual engineer OKRs | Creates competition, rewards gaming | Set OKRs at team level only |
| Quarterly reset without review | Misses the learning loop | Spend 2 hours reviewing last quarter's OKRs before setting new ones |
| 100% confidence KRs | Sandbagging wastes potential | If you're sure you'll hit it, set a more ambitious target |
Connecting OKRs to Performance
A common concern: "If OKRs are team-level, how do I evaluate individual performance?"
The answer: OKRs are not performance reviews. They're strategic alignment tools. Individual performance is assessed through:
- Contribution to team OKR outcomes (qualitative)
- Peer feedback on collaboration and technical leadership
- Code review quality and mentorship activity
- Scope of independent decision-making over time
Engineers who consistently enable their team to hit OKRs—through technical excellence, unblocking others, or simplifying complex problems—are your highest performers. They may not have the most commits.
Measuring OKR Effectiveness
How do you know if your OKR system is working?
| Signal | Healthy | Broken |
|---|---|---|
| KR completion rate | 60-70% of KRs hit target | >90% (sandbagging) or <40% (unrealistic) |
| Business metric correlation | Team OKR achievement correlates with company growth | No visible connection |
| Team engagement | Engineers can explain their OKRs and why they matter | Engineers can't recall their OKRs mid-quarter |
| Strategic conversations | OKRs spark discussion about priorities and tradeoffs | OKRs are set and forgotten until quarter end |
| Decision-making clarity | Teams use OKRs to say "no" to off-strategy requests | Everything is "priority 1" regardless of OKRs |
Actionable Takeaways
- Every engineering KR must connect to a business outcome. If you can't explain why the CEO cares, rewrite it.
- Measure outcomes, not output. "Users find content 2x faster" beats "Ship new search algorithm."
- Set OKRs at the team level. Individual OKRs create competition where you need collaboration.
- Target 60-70% confidence. If you're sure you'll hit every KR, you're not stretching enough.
- Review before resetting. Spend time understanding why last quarter's OKRs did or didn't land before writing new ones.
Good OKRs don't just measure engineering work—they make engineering work meaningful. When an engineer can say "I reduced search time by 50% and that drove $200K in incremental revenue," they're not just writing code. They're building a business. That's the point.
Recommended reading
The Legacy of Leadership: What Remains When You Leave
The thing people remember is not your architecture. It is not your processes. It is how you made them feel. Reflections on what actually endures from engineering leadership.
What 3 A.M. Incidents Taught Me That AWS Certifications Never Did
Twenty production incidents reviewed: why understanding beats fixing, what certifications actually train, and the habits that keep a team calm at 3 a.m.
An Engineering Leader's Sustainable Weekly Rhythm
A realistic weekly rhythm that balances strategy, people, and operational work — without burning out or losing yourself in back-to-back meetings.



Comments
No comments yet. Be the first to share your thoughts.