Engineering Velocity Metrics That Actually Matter
How to measure engineering team performance without gaming, vanity metrics, or destroying trust—focusing on metrics that drive real improvement

A VP once asked me to "increase sprint velocity by 30%." When I asked what problem that would solve, they couldn't articulate one. They'd read a blog post about high-performing teams and wanted a number to track. So I did something instructive: I told my team we were being measured on story points and watched them respond rationally. Within two sprints, story point estimates inflated by exactly 30%. Problem solved. Nothing changed.
That experience crystallized something I'd suspected: most engineering metrics measure what's easy to count, not what matters. And when you measure the wrong things, you get Goodhart's Law in action—the metric improves while the thing you actually care about stays the same or gets worse.
The Metrics Trap
Before discussing which metrics to use, I need to address why so many teams get metrics wrong:
| Common Metric | What People Think It Measures | What It Actually Measures |
|---|---|---|
| Story points completed | Team productivity | Team's estimation inflation rate |
| Lines of code | Engineering output | Verbosity of solutions |
| Pull requests per week | Individual activity | Willingness to split work into small pieces |
| Bugs found | Quality investment | How hard QA is looking |
| Hours worked | Dedication | Presence, not value |
None of these are inherently useless, but none of them directly measure what we actually care about: is the team effectively delivering value to users while maintaining sustainable practices?
The Four Metrics That Actually Work
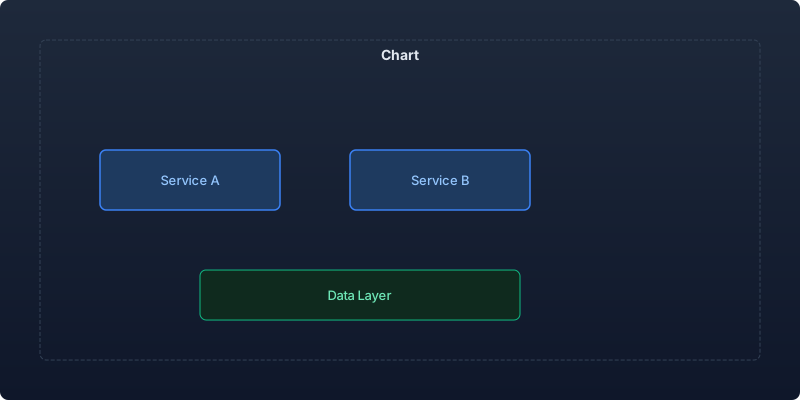
After experimenting with dozens of metrics across multiple teams, I've settled on four that consistently drive useful conversations without creating perverse incentives. These align closely with the DORA metrics but adapted for smaller teams:
1. Deployment Frequency How often does the team deploy to production?
Why it matters: Teams that deploy frequently have smaller changesets, faster feedback loops, and lower deployment risk. It's a leading indicator of process health.
How I use it: I track the trend, not the absolute number. If deployment frequency drops, I investigate what's blocking flow rather than pushing for more deploys.
2. Lead Time (Commit to Production) How long does it take for code to go from commit to running in production?
Why it matters: Long lead times indicate bottlenecks in review, testing, or deployment processes. They're a symptom of process friction.
How I use it: We break lead time into phases (review wait, CI time, deploy queue) to identify where time accumulates.
3. Change Failure Rate What percentage of deployments cause a failure in production?
Why it matters: Speed without quality is just moving faster toward problems. Change failure rate balances deployment frequency with stability.
How I use it: We track this without blame. A high rate means our testing and review processes need improvement, not that individuals are careless.
4. Time to Recovery How quickly do we restore service when something goes wrong?
Why it matters: Failures are inevitable. What separates high-performing teams is their ability to detect and resolve issues quickly.
How I use it: We review recovery time in post-incident reviews to identify systemic improvements to our detection and rollback capabilities.
Measuring Without Creating Perverse Incentives
The key principle: never tie individual performance evaluations to team metrics. The moment an engineer's promotion depends on deployment frequency, they'll start deploying trivial changes to pad the number. Metrics should inform team-level conversations, not individual performance reviews.
My guidelines:
- Metrics are for the team, by the team, discussed by the team
- Trends matter more than absolute values
- Context always accompanies numbers (a deployment frequency drop during a major migration is expected)
- No metric is used punitively—only diagnostically
- The team helps choose which metrics to track
The Invisible Metrics
Some of the most important things about an engineering team can't be measured directly. I track these through proxies:
Developer experience: How much friction do engineers experience in their daily work? Measured through quarterly developer surveys and occasional workflow observation.
Knowledge distribution: How concentrated is knowledge in the team? Measured through the "bus factor" exercise—for each critical system, how many people can effectively work on it?
Technical debt trajectory: Is the codebase getting easier or harder to work with over time? Measured through developer perception surveys and PR cycle time trends for similar-sized changes.
Growth trajectory: Are team members developing new skills and expanding their scope? Measured through promotion readiness assessments and self-reported skill growth.
These "soft" metrics often predict hard outcomes. A team with declining developer experience will eventually show declining velocity—but by then, you're in recovery mode rather than prevention mode.
How I Present Metrics to Leadership
Leadership wants to know if the engineering team is performing well. They often ask for simplistic metrics because they don't know what to ask for. Part of my job is educating them on useful metrics and providing context.
What I share upward:
- DORA metrics with trend arrows (improving/declining/stable)
- Customer-impacting incidents per quarter with severity distribution
- Major deliverables shipped vs. planned (with context on scope changes)
- Team health indicators (engagement scores, attrition risk, open positions)
What I don't share upward:
- Individual engineer metrics of any kind
- Raw story point velocity (it's meaningless across teams)
- Lines of code or PR counts
- Anything that could be used to compare teams without context
Team-Level Metric Reviews
Monthly, the team reviews our metrics together. The format:
- Show the numbers (5 minutes): Present the four core metrics with trends
- Hypothesize (10 minutes): What's driving the trends? What changed?
- Identify one action (10 minutes): Pick one thing to try improving
- Review last month's action (5 minutes): Did our previous intervention work?
This keeps metrics as a tool for the team rather than a weapon against them. Engineers who participate in choosing and interpreting metrics buy into improvement efforts.
When Metrics Disagree
Sometimes metrics conflict. Deployment frequency might be high while lead time is also high. Change failure rate might drop while customer complaints increase. When metrics disagree, it's a signal that your measurement model is incomplete.
My approach to conflicting metrics:
- Investigate the story behind the numbers before reacting
- Consider whether one metric is being gamed (intentionally or accidentally)
- Look for hidden variables that explain the apparent contradiction
- Add a complementary metric if you identify a blind spot
For example, we once had high deployment frequency with increasing customer complaints. Investigation revealed we were deploying many small fixes for bugs introduced by the frequent deploys themselves—churn masquerading as velocity.
Key Takeaways
- Most common engineering metrics (story points, lines of code, PRs per week) measure activity, not value
- Focus on four core metrics: deployment frequency, lead time, change failure rate, and time to recovery
- Never tie team metrics to individual performance evaluations—this guarantees gaming
- Track "invisible" metrics (developer experience, knowledge distribution, tech debt trajectory) through surveys and proxies
- Present metrics to leadership with context and trends, never raw numbers that invite inappropriate comparison
- Run monthly team metric reviews where the team hypothesizes causes and chooses improvement actions
- When metrics conflict, investigate the story rather than optimizing one number at the expense of another
- The goal of metrics is better conversations about team health, not better dashboards
The best engineering metrics are ones that, when they improve, you can feel the difference in daily work. If a metric improves and nobody notices a real change, you're measuring the wrong thing.
Recommended reading

The Legacy of Leadership: What Remains When You Leave
The thing people remember is not your architecture. It is not your processes. It is how you made them feel. Reflections on what actually endures from engineering leadership.
What 3 A.M. Incidents Taught Me That AWS Certifications Never Did
Twenty production incidents reviewed: why understanding beats fixing, what certifications actually train, and the habits that keep a team calm at 3 a.m.
An Engineering Leader's Sustainable Weekly Rhythm
A realistic weekly rhythm that balances strategy, people, and operational work — without burning out or losing yourself in back-to-back meetings.



Comments
No comments yet. Be the first to share your thoughts.