Per-Team Cost Allocation in Shared Kubernetes Clusters: From Chaos to Clarity
Implementing accurate per-namespace cost allocation in multi-tenant Kubernetes clusters, covering request vs. usage attribution, shared resource amortization, and building showback dashboards that drive accountability.

Our platform engineering team manages 6 EKS clusters shared by 23 product teams. Total monthly Kubernetes spend: $420K. When leadership asked "which team costs the most and why?", we could not answer. AWS Cost Explorer shows cluster-level costs, not pod-level. Node costs are shared. Spot instances complicate pricing. Shared services (Istio, monitoring, ingress) benefit everyone but nobody wants to own. Here is how we built a per-team cost allocation system that attributes 97% of cluster costs to specific teams and drove a 22% cost reduction through accountability alone.
Why This Is Hard
Kubernetes cost allocation has fundamental challenges that do not exist in traditional VM-based infrastructure:
- Bin-packing: Multiple pods from different teams share a single node. How do you split the node cost?
- Requests vs. usage: A pod requesting 4 CPU but using 0.5 CPU — who pays for the 3.5 idle CPUs?
- Shared infrastructure: Service mesh, DNS, monitoring, ingress controllers serve all teams equally.
- Spot pricing: Nodes have different costs depending on when and how they were acquired.
- Persistent volumes: Storage costs are straightforward but often forgotten.
- Network: Cross-AZ traffic charges are invisible at the pod level.
Architecture: The Cost Attribution Pipeline
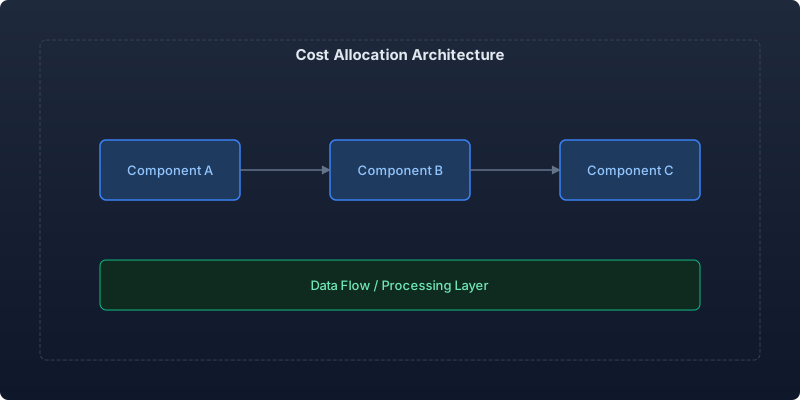
Our pipeline runs hourly, collecting metrics from three sources and producing per-team cost breakdowns:
import boto3
import pandas as pd
from datetime import datetime, timedelta
from dataclasses import dataclass, field
from kubernetes import client, config

@dataclass
class PodCostRecord:
    namespace: str
    team: str
    pod_name: str
    node_name: str
    cpu_requested: float    # vCPUs
    cpu_used: float         # vCPUs (avg over period)
    memory_requested_gb: float
    memory_used_gb: float
    gpu_requested: int
    storage_gb: float
    network_egress_gb: float
    duration_hours: float
    allocated_cost: float = 0.0

@dataclass
class NodeCost:
    instance_id: str
    instance_type: str
    node_name: str
    hourly_cost: float
    total_cpu: float
    total_memory_gb: float
    is_spot: bool
    availability_zone: str

class KubernetesCostAllocator:
    """Allocates cluster costs to teams based on resource consumption."""

    def __init__(self, cluster_name: str, allocation_strategy: str = 'weighted'):
        """
        Args:
            allocation_strategy: 'request' (charge by requests),
                               'usage' (charge by actual usage),
                               'weighted' (70% request, 30% usage - our default)
        """
        self.cluster_name = cluster_name
        self.strategy = allocation_strategy
        config.load_incluster_config()
        self.k8s_core = client.CoreV1Api()
        self.k8s_metrics = client.CustomObjectsApi()
        self.ec2 = boto3.client('ec2')
        self.pricing_cache = {}

    def allocate_hourly(self) -> pd.DataFrame:
        """Run full cost allocation for the current hour."""
        # Step 1: Get node costs from AWS
        node_costs = self._get_node_costs()

        # Step 2: Get pod resource requests and usage
        pod_records = self._get_pod_metrics()

        # Step 3: Allocate node costs to pods
        allocated = self._allocate_costs(node_costs, pod_records)

        # Step 4: Add shared infrastructure amortization
        allocated = self._amortize_shared_costs(allocated)

        # Step 5: Add storage and network costs
        allocated = self._add_storage_costs(allocated)
        allocated = self._add_network_costs(allocated)

        return pd.DataFrame([vars(r) for r in allocated])

    def _get_node_costs(self) -> dict[str, NodeCost]:
        """Fetch actual costs for each node in the cluster."""
        nodes = self.k8s_core.list_node()
        node_costs = {}

        for node in nodes.items:
            instance_id = node.spec.provider_id.split('/')[-1]
            instance_type = node.metadata.labels.get(
                'node.kubernetes.io/instance-type', 'unknown'
            )
            is_spot = node.metadata.labels.get(
                'karpenter.sh/capacity-type', 'on-demand'
            ) == 'spot'

            hourly_cost = self._get_instance_hourly_cost(
                instance_type, is_spot
            )

            allocatable = node.status.allocatable
            total_cpu = self._parse_cpu(allocatable.get('cpu', '0'))
            total_memory = self._parse_memory(allocatable.get('memory', '0'))

            node_costs[node.metadata.name] = NodeCost(
                instance_id=instance_id,
                instance_type=instance_type,
                node_name=node.metadata.name,
                hourly_cost=hourly_cost,
                total_cpu=total_cpu,
                total_memory_gb=total_memory,
                is_spot=is_spot,
                availability_zone=node.metadata.labels.get(
                    'topology.kubernetes.io/zone', ''
                ),
            )

        return node_costs

    def _allocate_costs(self,
                        node_costs: dict[str, NodeCost],
                        pod_records: list[PodCostRecord]) -> list[PodCostRecord]:
        """Distribute node costs across pods using weighted strategy."""

        # Group pods by node
        pods_by_node: dict[str, list[PodCostRecord]] = {}
        for pod in pod_records:
            pods_by_node.setdefault(pod.node_name, []).append(pod)

        for node_name, pods in pods_by_node.items():
            if node_name not in node_costs:
                continue

            node = node_costs[node_name]

            # Calculate total resource claims on this node
            total_cpu_requested = sum(p.cpu_requested for p in pods)
            total_cpu_used = sum(p.cpu_used for p in pods)
            total_mem_requested = sum(p.memory_requested_gb for p in pods)
            total_mem_used = sum(p.memory_used_gb for p in pods)

            for pod in pods:
                if self.strategy == 'request':
                    # Charge based on what you reserved
                    cpu_share = pod.cpu_requested / max(total_cpu_requested, 0.01)
                    mem_share = pod.memory_requested_gb / max(total_mem_requested, 0.01)
                elif self.strategy == 'usage':
                    # Charge based on what you actually used
                    cpu_share = pod.cpu_used / max(total_cpu_used, 0.01)
                    mem_share = pod.memory_used_gb / max(total_mem_used, 0.01)
                else:
                    # Weighted: 70% request, 30% usage
                    cpu_share = (
                        0.7 * (pod.cpu_requested / max(total_cpu_requested, 0.01)) +
                        0.3 * (pod.cpu_used / max(total_cpu_used, 0.01))
                    )
                    mem_share = (
                        0.7 * (pod.memory_requested_gb / max(total_mem_requested, 0.01)) +
                        0.3 * (pod.memory_used_gb / max(total_mem_used, 0.01))
                    )

                # Split node cost: 60% by CPU, 40% by memory
                pod.allocated_cost = node.hourly_cost * (
                    0.6 * cpu_share + 0.4 * mem_share
                )

        return pod_records

    def _amortize_shared_costs(self,
                               records: list[PodCostRecord]) -> list[PodCostRecord]:
        """Distribute shared infrastructure costs across all teams."""
        shared_namespaces = {
            'istio-system', 'monitoring', 'kube-system',
            'cert-manager', 'ingress-nginx', 'karpenter',
        }

        shared_cost = sum(
            r.allocated_cost for r in records
            if r.namespace in shared_namespaces
        )

        # Distribute shared costs proportionally to each team's direct cost
        team_records = [r for r in records if r.namespace not in shared_namespaces]
        total_direct = sum(r.allocated_cost for r in team_records)

        if total_direct > 0:
            for record in team_records:
                share = record.allocated_cost / total_direct
                record.allocated_cost += shared_cost * share

        # Remove shared namespace records (now amortized)
        return team_records

    def _parse_cpu(self, cpu_str: str) -> float:
        """Parse Kubernetes CPU notation to vCPUs."""
        if cpu_str.endswith('m'):
            return int(cpu_str[:-1]) / 1000
        return float(cpu_str)

    def _parse_memory(self, mem_str: str) -> float:
        """Parse Kubernetes memory notation to GB."""
        units = {'Ki': 1024, 'Mi': 1024**2, 'Gi': 1024**3}
        for suffix, multiplier in units.items():
            if mem_str.endswith(suffix):
                return int(mem_str[:-len(suffix)]) * multiplier / (1024**3)
        return int(mem_str) / (1024**3)

    def _get_instance_hourly_cost(self, instance_type: str, is_spot: bool) -> float:
        """Look up hourly cost for instance type."""
        # Simplified - production uses AWS Pricing API with spot price history
        cache_key = f"{instance_type}:{'spot' if is_spot else 'od'}"
        if cache_key not in self.pricing_cache:
            # Placeholder - real implementation queries AWS Pricing API
            self.pricing_cache[cache_key] = 0.10  # Default fallback
        return self.pricing_cache[cache_key]

    def _add_storage_costs(self, records):
        """Add PVC costs to pod records."""
        return records  # Implementation queries EBS pricing per PVC

    def _add_network_costs(self, records):
        """Add cross-AZ network transfer costs."""
        return records  # Implementation uses VPC flow logs

    def _get_pod_metrics(self) -> list[PodCostRecord]:
        """Fetch current pod resource requests and usage."""
        return []  # Implementation uses metrics-server API
The Showback Dashboard
Raw numbers in a database are useless without visualization. We built a Grafana dashboard showing:
# Grafana dashboard panels (simplified JSON model reference)
panels:
  - title: "Monthly Cost by Team"
    type: bar-chart
    query: |
      SELECT
        team,
        SUM(allocated_cost) as monthly_cost,
        SUM(cpu_requested) as total_cpu_reserved,
        AVG(cpu_used / NULLIF(cpu_requested, 0)) * 100 as avg_utilization
      FROM cost_allocation
      WHERE timestamp > NOW() - INTERVAL '30 days'
      GROUP BY team
      ORDER BY monthly_cost DESC

  - title: "Cost Efficiency Score (Usage/Request Ratio)"
    type: gauge
    query: |
      SELECT
        team,
        AVG(cpu_used / NULLIF(cpu_requested, 0)) * 100 as efficiency
      FROM cost_allocation
      WHERE timestamp > NOW() - INTERVAL '7 days'
      GROUP BY team

  - title: "Waste Heatmap (Over-Requested Resources)"
    type: heatmap
    query: |
      SELECT
        team,
        namespace,
        SUM((cpu_requested - cpu_used) * node_hourly_cost * 0.6 / total_node_cpu)
          as cpu_waste_cost
      FROM cost_allocation_detailed
      WHERE timestamp > NOW() - INTERVAL '7 days'
      GROUP BY team, namespace
The 70/30 Weighted Strategy: Why Not Pure Usage?
We initially tried pure usage-based allocation. Teams gamed it by setting minimal resource requests (100m CPU) while relying on burstable capacity. This caused:
- Bin-packing failures (scheduler could not place pods efficiently)
- OOM kills during contention (no memory guaranteed)
- Noisy-neighbor incidents (one team bursting affected others)
The 70% request / 30% usage split incentivizes right-sizing:
- Set requests too high? You pay for idle capacity (the 70% request component).
- Set requests too low? You still pay for what you use (the 30% usage component) and risk OOM kills.
This naturally drives teams toward accurate resource requests without punishing occasional bursts.
Results: 6 Months of Showback
| Metric | Before Showback | After 6 Months | Change |
|---|---|---|---|
| Total monthly K8s spend | $420K | $327K | -22% |
| Average CPU utilization | 31% | 54% | +74% |
| Namespaces with >50% waste | 34 | 8 | -76% |
| Teams reviewing costs weekly | 2 | 19 | +850% |
| Right-sizing PRs submitted | 3/month | 47/month | +1,467% |
The 22% cost reduction happened without any platform-level changes. Teams simply right-sized their deployments once they could see their costs. The platform team's contribution was visibility, not enforcement.
Handling Edge Cases
Auto-scaled workloads: For HPAs, we track the average replica count over the billing period rather than the maximum. This prevents teams from being penalized for scaling up during legitimate traffic.
DaemonSets: Cluster-wide DaemonSets (Datadog agent, Falco, etc.) are shared infrastructure costs, amortized proportionally.
Jobs and CronJobs: Short-lived jobs are attributed based on actual duration × resources used. A 5-minute job using 8 CPUs costs the team (5/60) × 8 × node_hourly_cost_per_cpu.
GPU workloads: GPU instances are 5-10x more expensive. We attribute GPU node costs 80% by GPU allocation, 20% by CPU/memory to avoid subsidizing ML teams' GPU usage through general compute budgets.
Lessons Learned
Start with showback, not chargeback. Showback = visibility. Chargeback = budget deductions. Start by showing teams what they cost. Once the data is trusted (give it 3 months), transition to budget accountability. Jumping straight to chargeback creates political resistance before the data is validated.
Team labels are your foundation. Every namespace must have a team label. Every pod must inherit it. Enforce this via admission webhook — reject deployments missing team ownership labels. Without consistent labeling, cost attribution is impossible.
Shared costs cause the most arguments. Our amortization strategy (proportional to direct costs) was challenged by small teams who argued they should pay less for shared infrastructure. We compromised: 70% proportional to direct cost, 30% equal split across teams using the cluster.
Spot savings should benefit the platform, not individual teams. We charge teams on-demand rates regardless of whether their pod landed on a spot instance. The platform team keeps the spot discount as budget to improve shared infrastructure. This prevents gaming where teams try to target spot nodes.
Conclusion
Kubernetes cost allocation is 30% technical problem and 70% organizational problem. The technical system — metrics collection, node cost attribution, amortization logic — is solvable in a sprint. The organizational challenge — agreeing on allocation strategies, handling shared costs fairly, building trust in the numbers — takes months. Start with showback visibility, let teams self-correct, and only escalate to enforcement if voluntary optimization stalls. In our case, visibility alone drove a 22% reduction. The dashboard was the intervention; the pipeline was just infrastructure to support it.
Recommended reading

Measuring and Eliminating Toil: From 40% to 12% of Engineering Time
A systematic approach to identifying, measuring, and automating toil—the repetitive operational work that scales linearly with service growth and prevents engineers from doing creative work.

Serverless Postgres in Production: Branching, Scale-to-Zero, and the End of Database Provisioning
Running Neon serverless Postgres in production for 8 months — covering database branching workflows, scale-to-zero economics, connection pooling, and migration from RDS.
Synthetic Monitors From 12 Regions Catching Issues Before Users
How to implement global synthetic monitoring that detects availability and performance degradation from every major region—catching issues minutes before real users are impacted.



Comments
No comments yet. Be the first to share your thoughts.