Measuring and Improving Remote Engineering Team Productivity
Beyond "butts in seats"—a data-driven approach to understanding, measuring, and systematically improving engineering output in distributed teams.

When our logistics startup went fully remote in 2020, our lead investor asked me a question I couldn't answer: "How do you know your engineers are productive?"
I didn't have a good answer. We'd been measuring presence—who was in the office, who was in meetings, who was "online" on Slack. None of that translates to a remote environment. Worse, none of it ever actually measured productivity. We'd been confusing activity with output for years.
Over the next 18 months, I built a measurement and improvement system that increased our team's throughput by 34% while reducing working hours by 12%. Remote work wasn't the problem—our measurement approach was.
Why Traditional Productivity Metrics Fail Remote Teams
Most engineering leaders default to one of three broken measurement approaches:
Activity metrics (surveillance): Lines of code, commits per day, hours logged, Slack response times. These measure motion, not progress. Your most productive engineer might write 50 lines that solve a problem your least productive engineer would take 500 lines and 3 days to approach differently.
Outcome metrics only (too lagged): Revenue features shipped per quarter, customer satisfaction scores. These matter, but by the time you see them decline, you've lost months. You need leading indicators.
Subjective assessment (inconsistent): Manager gut feeling about who's "performing." This introduces bias—particularly against remote workers who are less visible and against engineers who communicate differently.
The framework I use combines three layers: flow metrics (leading), delivery metrics (concurrent), and impact metrics (lagging).
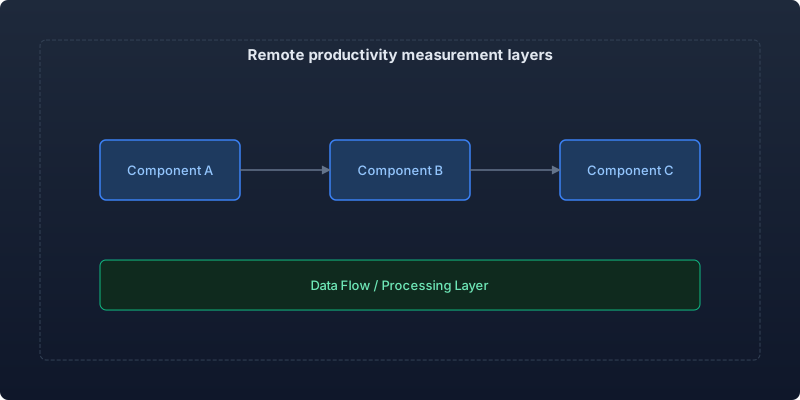
The Three-Layer Measurement Framework
Layer 1: Flow Metrics (Leading Indicators)
Flow metrics tell you if the conditions for productivity exist. They don't measure output directly—they measure whether your system enables output.
| Metric | What It Tells You | Target Range | Measurement Tool |
|---|---|---|---|
| Uninterrupted focus time | Hours of deep work per day | 4+ hours/day | Calendar analysis + Slack quiet hours |
| Meeting load | Time spent in synchronous meetings | <25% of week | Calendar audit |
| Context switches | How often engineers change tasks | <4 per day | Project management data |
| PR wait time | Time PRs sit waiting for review | <6 hours | GitHub/GitLab analytics |
| Environment stability | How often tooling blocks work | <2 incidents/week | Developer surveys + incident data |
Key insight: When flow metrics decline, delivery metrics follow 2-3 weeks later. This gives you time to intervene.
At our company, we discovered that our highest performers had one thing in common: 4.5+ hours of uninterrupted time per day. Our lowest performers averaged 2.1 hours. The difference wasn't talent—it was meeting load and Slack interruption patterns.
Layer 2: Delivery Metrics (Concurrent Indicators)
Delivery metrics measure actual engineering output—but at the team level, not the individual level. Individual delivery metrics create perverse incentives (gaming commits, shipping half-baked features).
| Metric | Definition | Team Target | Measured How |
|---|---|---|---|
| Cycle time | Commit to production | <3 days (median) | CI/CD pipeline data |
| Throughput | Features/stories completed per sprint | Consistent or trending up | Sprint data |
| Review quality | Defects caught in review vs production | >80% pre-production | Bug tracking correlation |
| Deployment frequency | Production deploys per team per week | 8+ | Deployment logs |
| WIP limits | Work items in progress per engineer | <3 | Board snapshots |
Critical nuance: Delivery metrics must be measured at the team level and trended over time. A single sprint's numbers mean nothing. Look for 4-6 sprint trends.
Layer 3: Impact Metrics (Lagging Indicators)
Impact metrics connect engineering work to business outcomes. They're measured quarterly and used for strategic decisions, not day-to-day management.
| Metric | Measurement | Healthy Signal |
|---|---|---|
| Feature adoption rate | % of shipped features with >10% user engagement | >60% |
| Production stability | Customer-impacting incidents per 1000 deploys | <5 |
| Technical leverage | Revenue per engineer (trailing 12 months) | Growing quarter-over-quarter |
| Retention impact | Correlation between shipping rate and engineer retention | Positive |
The Remote Productivity Improvement Playbook
Measurement alone doesn't improve productivity. Here are the five interventions that generated our 34% throughput increase:
Intervention 1: The Maker Schedule Default
We restructured our default calendar to protect deep work:
- No-meeting blocks: Tuesday and Thursday are meeting-free from 9 AM to 1 PM (in each engineer's local timezone)
- Meeting consolidation: All recurring meetings happen Monday, Wednesday, or Friday
- Async-first standup: Written updates replaced daily video standups (saved 2.5 hours/week per engineer)
- Meeting cap: No engineer attends more than 8 hours of meetings per week
Result: Average daily focus time increased from 2.8 hours to 4.6 hours within 6 weeks.
Intervention 2: Async Communication Protocol
We defined explicit communication norms:
| Communication Type | Channel | Expected Response Time |
|---|---|---|
| Blocking issue | Direct message + mention | <2 hours |
| Code review request | GitHub notification | <6 hours |
| Design discussion | RFC document + comments | <24 hours |
| General question | Team channel | <4 hours |
| FYI / context sharing | Weekly digest | No response needed |
The key rule: Nothing is urgent unless someone explicitly says it is. Slack messages are not pages. If your house is on fire, call someone—don't type in a channel.
Result: Engineers reported 40% fewer "I couldn't focus because I was waiting for a response" instances. Simultaneously, actual response times improved by 25% because engineers batch-checked messages during natural breaks.
Intervention 3: Outcome-Based Sprint Planning
We stopped estimating effort and started defining outcomes:
Before: "Implement payment retry logic (5 story points)" After: "Failed payment recovery rate increases from 12% to 35% (measured in production after 1 week)"
This shifted the team from thinking about tasks to thinking about impact. Engineers found creative solutions because they were evaluated on the outcome, not the implementation path.
Result: 22% reduction in features shipped that nobody used (from 38% to 16% of shipped features achieving <10% adoption).
Intervention 4: The Weekly Retrospective Cadence
Remote teams lose the organic feedback loops that offices provide. We replaced them with structured weekly retros (25 minutes):
- What slowed you down this week? (5 minutes, written)
- Pattern identification (10 minutes, discussion)
- One fix for next week (5 minutes, commitment)
- Celebration (5 minutes, shoutouts)
The critical rule: every retro produces exactly one change for the following week. Not three. Not zero. One. This prevents retro fatigue while ensuring continuous improvement.
Result: Over 12 months, we implemented 48 process improvements. Cumulatively, these reduced cycle time from 5.2 days to 2.8 days.
Intervention 5: Intentional Social Connection
Productivity isn't purely mechanical. Isolated engineers are less productive because they hesitate to ask for help, miss context in discussions, and lose motivation.
Our social connection investments:
- Weekly virtual coffee: Random 1:1 pairings for 15-minute non-work conversations
- Monthly team events: 2-hour sessions with an activity (cooking class, game, workshop)
- Quarterly in-person offsites: 3-day gatherings focused on relationship building, not work
- Buddy system for new hires: Assigned social partner for first 60 days
Result: Employee NPS increased from 32 to 58. Voluntary attrition dropped from 22% to 11% annually. Engineers who reported feeling "connected to teammates" shipped 28% more per sprint than those who didn't.
Anti-Patterns to Avoid
Surveillance Software
Any tool that tracks keystrokes, screenshots, or mouse movements destroys trust and drives away your best engineers. I've seen two companies install monitoring software. Both lost 3-4 senior engineers within 60 days. The engineers who stayed became actively disengaged—they learned to game the metrics instead of doing meaningful work.
Individual Leaderboards
Ranking engineers by commits, PRs, or tickets closed creates competition where you need collaboration. Your most impactful engineer might spend 60% of their time unblocking others—that shows up as low individual metrics but massive team improvement.
Always-On Expectations
If you expect Slack responses within 5 minutes at all times, you're not running a remote team—you're running a surveillance operation with commute-free housing. Async means async. Define response time expectations explicitly and make them reasonable.
"Cameras On" Mandates
Requiring video in every meeting is a proxy for trust. It adds cognitive load, discriminates against people with non-ideal home environments, and provides no measurable productivity benefit. Make cameras optional. Judge people by their work, not their facial expressions.
Building the Dashboard
I track remote team health on a single weekly dashboard:
| Metric | Source | Red Flag |
|---|---|---|
| Avg focus hours/day | Calendar data | <3.5 hours |
| PR review turnaround | GitHub | >12 hours (median) |
| Sprint completion rate | Project management | <70% |
| Team sentiment | Weekly pulse survey (1-5) | <3.5 average |
| Cycle time trend | CI/CD data | Increasing 3 weeks in a row |
| Meeting load | Calendar | >30% of working hours |
When two or more metrics hit red simultaneously, something systemic is wrong. Investigate immediately—don't wait for the quarterly review.
Actionable Takeaways
- Measure flow, delivery, and impact in layers. Leading indicators give you time to fix problems before they affect output.
- Protect deep work time aggressively. 4+ hours of uninterrupted focus daily is the single strongest predictor of engineering productivity.
- Define explicit async communication norms. Don't let Slack become a synchronous chat room.
- Measure outcomes at the team level, not individual activity. Individual metrics create perverse incentives.
- Invest in social connection intentionally. Connected engineers are measurably more productive and less likely to leave.
Remote engineering productivity isn't about monitoring harder—it's about creating the conditions where skilled engineers do their best work. Get the environment right, measure the right things, and trust your team. The results speak for themselves.
Recommended reading
The Legacy of Leadership: What Remains When You Leave
The thing people remember is not your architecture. It is not your processes. It is how you made them feel. Reflections on what actually endures from engineering leadership.
What 3 A.M. Incidents Taught Me That AWS Certifications Never Did
Twenty production incidents reviewed: why understanding beats fixing, what certifications actually train, and the habits that keep a team calm at 3 a.m.
An Engineering Leader's Sustainable Weekly Rhythm
A realistic weekly rhythm that balances strategy, people, and operational work — without burning out or losing yourself in back-to-back meetings.



Comments
No comments yet. Be the first to share your thoughts.