Feature Flags and the Experimentation Culture
How to build a feature flag system that enables rapid experimentation, safe rollouts, and data-driven product decisions at startup speed

Feature flags are the single most impactful engineering practice for startups pursuing product-market fit. They decouple deployment from release, enabling your team to ship code continuously while controlling exactly who sees what, when. But feature flags are more than a deployment technique — they are the infrastructure that enables an experimentation culture.
An experimentation culture is one where every product decision can be validated with real user data before full commitment. Where "I think users want X" becomes "Let us test whether users want X with 10% of traffic." Where killing a feature is a data-driven decision, not a political one.
Why Feature Flags Transform Startup Engineering
Without feature flags, your options for testing product hypotheses are limited:
| Without Flags | With Flags |
|---|---|
| Ship complete features or nothing | Ship incremental progress behind flags |
| Rollback = emergency deployment | Rollback = flip a switch in seconds |
| Test in staging (not real users) | Test with real users at controlled scale |
| Everyone sees the same product | Different users see different experiences |
| Feature launch is a big bang event | Feature launch is gradual and monitored |
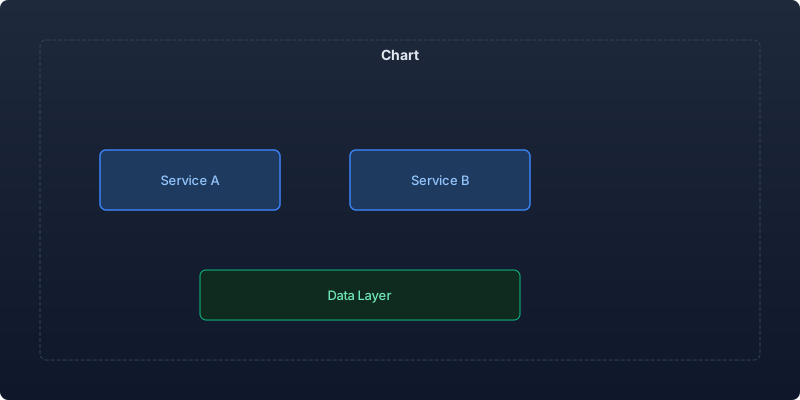
The Feature Flag Architecture
Types of Flags
Not all feature flags serve the same purpose. Classify them to manage lifecycle and complexity:
| Flag Type | Purpose | Lifespan | Owner |
|---|---|---|---|
| Release flag | Hide incomplete work | Days to weeks | Engineer |
| Experiment flag | A/B test variants | 2-6 weeks | Product |
| Operational flag | Circuit breakers, kill switches | Permanent | Engineering |
| Permission flag | Feature entitlement by plan/tier | Permanent | Product |
| Temporary flag | Migration, refactoring rollout | Days | Engineer |
Architecture Decisions
Client-side vs server-side evaluation:
| Approach | Latency | Security | Complexity |
|---|---|---|---|
| Server-side (API call per request) | Higher | High (flags never exposed) | Medium |
| Client-side (bundled config) | Lower | Lower (flags visible in client) | Lower |
| Edge-side (CDN evaluation) | Lowest | Medium | Higher |
For most startups, server-side evaluation with client-side caching provides the best balance of security and performance.
Storage and distribution:
- Simple: Database table + in-memory cache (rebuild needed for flag changes)
- Medium: Database + pub/sub for real-time propagation
- Advanced: Dedicated service with SDKs and streaming updates
Start simple. A database table with flag name, state, and targeting rules handles most needs until you have dozens of concurrent experiments.
The Evaluation Model
A feature flag evaluation considers:
Input: user_id, user_attributes, flag_name
Process:
  1. Is the flag enabled globally?
  2. Does the user match any targeting rules?
  3. What percentage rollout applies?
  4. Hash user_id for consistent assignment
Output: variant (boolean or multivariate)
Consistent hashing ensures the same user always sees the same variant, preventing flickering experiences.
Building Experimentation Infrastructure
The Experiment Lifecycle
Every experiment follows a structured lifecycle:
- Design — Define hypothesis, metrics, sample size, duration
- Instrument — Add flag + analytics events
- Launch — Enable for target percentage
- Monitor — Watch guardrail metrics for regressions
- Analyze — Statistical analysis of primary and secondary metrics
- Decide — Ship, kill, or iterate
- Cleanup — Remove flag, promote or delete code
The Experiment Document
Before launching any experiment, document:
| Field | Content |
|---|---|
| Hypothesis | "We believe [change] will cause [metric] to [improve/decline] by [amount]" |
| Primary metric | The one number that determines success |
| Secondary metrics | Additional signals to consider |
| Guardrails | Metrics that must not degrade |
| Sample size | Minimum users per variant for significance |
| Duration | How long to run before analyzing |
| Kill criteria | What would cause early termination |
| Owner | Who makes the ship/kill decision |
Statistical Rigor
Common statistical mistakes in startup experimentation:
Problem: Peeking. Checking results daily and stopping when they look good inflates false positive rates from 5% to 25-50%.
Solution: Pre-register experiment duration. Use sequential testing methods if you must peek (Bayesian approaches or alpha-spending functions).
Problem: Underpowered tests. Running experiments with too few users produces noise, not signal.
Solution: Calculate required sample size before launching. For a typical 5% baseline conversion rate detecting a 20% relative change, you need approximately 4,000 users per variant.
Problem: Multiple comparisons. Testing 5 metrics simultaneously without correction finds "significant" results by chance.
Solution: Designate one primary metric. Apply Bonferroni correction or similar for secondary metrics.
Building the Experimentation Culture
From Engineering Practice to Company Culture
Feature flags start as an engineering tool. They become a competitive advantage when experimentation becomes a company-wide practice:
Make experiments visible. A shared dashboard showing running experiments, their hypotheses, and their results creates transparency and learning.
Celebrate learning. When an experiment reveals that a proposed feature does not work, celebrate the knowledge gained and the engineering time saved.
Lower the experiment cost. The cheaper an experiment is to run, the more experiments your team will run. Invest in tooling that reduces experiment setup time.
Share results broadly. Monthly experiment retrospectives where the whole team reviews what was learned builds shared product intuition.
The Experiment Velocity Metric
Track experiments run per month as a leading indicator of product learning speed:
| Stage | Target Experiment Velocity | Team Size |
|---|---|---|
| Pre-PMF | 4-8 experiments/month | 2-4 engineers |
| PMF discovery | 8-15 experiments/month | 4-8 engineers |
| Growth optimization | 15-30 experiments/month | 8-15 engineers |
Avoiding Experimentation Anti-Patterns
Analysis paralysis. Do not experiment on everything. Some decisions are obvious or low-stakes enough to ship without data.
HiPPO overriding. If the highest-paid person's opinion always overrides experiment results, the culture is performative, not data-driven.
Experiment fatigue. Running too many simultaneous experiments on the same users creates interaction effects and a confusing product experience.
Flag proliferation. Stale flags accumulate and create maintenance burden. Enforce cleanup with automated alerts for flags older than their intended lifespan.
Flag Lifecycle Management
The Cleanup Problem
Feature flags left in code after their purpose is served create complexity:
| Flag Age | Risk | Action |
|---|---|---|
| < 2 weeks | None | Active experiment or release |
| 2-6 weeks | Low | Should be resolved or extended with justification |
| 6-12 weeks | Medium | Likely forgotten, review immediately |
| > 12 weeks | High | Technical debt, remove regardless |
Automation for Cleanup
- Alert when flags exceed their intended lifespan
- Track flag count over time (should not grow indefinitely)
- Include flag cleanup in sprint planning
- Tag flags with creation date, owner, and intended removal date
Tool Selection
| Tool | Best For | Cost (Seed) | Self-Hosted Option |
|---|---|---|---|
| LaunchDarkly | Enterprise features, complex targeting | $$$$ | No |
| Split.io | Experimentation focus | $$$ | No |
| PostHog | Combined analytics + flags | $-$$ | Yes |
| Unleash | Open source, self-hosted | $ | Yes |
| Flagsmith | Balanced features, self-hosted option | $-$$ | Yes |
| Custom (database) | Simplicity, control | $ | N/A |
For seed-stage startups, I recommend PostHog (combined analytics + flags) or a custom database solution. Graduate to dedicated platforms when experiment volume justifies the cost.
Key Takeaways
- Feature flags decouple deployment from release, enabling continuous delivery while controlling exactly who sees what
- Classify flags by type (release, experiment, operational, permission, temporary) to manage lifecycle and prevent accumulation
- Every experiment needs pre-defined hypothesis, primary metric, sample size, duration, and kill criteria before any code is written
- Track experiment velocity (experiments per month) as a leading indicator of product learning speed
- Enforce flag cleanup automation — flags older than their intended lifespan become technical debt that compounds
- Statistical rigor matters: pre-register duration, calculate sample sizes, and correct for multiple comparisons
- Feature flags start as an engineering tool but become a competitive advantage when experimentation becomes a company-wide culture
The startups that find product-market fit fastest are not the ones that build the most features. They are the ones that learn the most about their users per unit of time. Feature flags and experimentation culture are the infrastructure that makes rapid learning possible.
Recommended reading

Why the Gulf Will Produce the Next Wave of Logistics Tech Unicorns
Capital, demographics, infrastructure, and regulation are converging in the GCC. A thesis from inside a Qatari delivery platform doing 16M orders a year.
Post-Acquisition Technical Integration Playbook
How CTOs navigate the technical integration process after an acquisition, from day-one decisions through full platform consolidation
Landing Your First Enterprise Customer as a Startup: The Technical Credibility Playbook
A tactical guide for startup CTOs navigating enterprise sales cycles, from security questionnaires to architecture reviews, with timelines and preparation checklists.



Comments
No comments yet. Be the first to share your thoughts.