When to Break the Monolith: The Traffic, Team, and Complexity Signals That Say "Now"
A data-driven framework for timing the monolith-to-microservices transition, with specific signals, anti-signals, and the extraction sequence that minimizes risk.

The monolith-to-microservices debate has been done to death in blog posts that either worship microservices or dismiss them as cargo cult architecture. Neither position is useful for a startup CTO facing a real decision with real constraints. After leading this transition at two startups — one too early (painful, wasteful) and one at the right time (smooth, enabling) — I've identified the specific, measurable signals that tell you when the monolith has become the bottleneck, not just an inconvenience.
The Timing Problem
Breaking up a monolith too early creates unnecessary operational complexity. Too late, and you're fighting the architecture while trying to grow. The window matters:
| Timing | Outcome | Impact |
|---|---|---|
| Way too early (< 10 engineers) | Infrastructure costs 3× higher, ops burden unsustainable | Engineers spend 40% on infrastructure, not product |
| Slightly early (10-15 engineers) | Some benefit, but maintenance overhead high | Slows down without proportional gain |
| Right time (signal-driven) | Targeted extraction unlocks growth | Teams move independently, velocity increases |
| Slightly late (signals ignored 6mo) | Painful but recoverable | 2-3 months of higher-than-necessary friction |
| Way too late (signals ignored 12mo+) | Emergency extraction under pressure | Production incidents force rushed migration |
The first startup I led to microservices had 8 engineers and 2,000 daily active users. We spent 4 months building service infrastructure (API gateway, service discovery, distributed tracing, shared auth) that served the same traffic our monolith handled fine. Those 4 months of engineering time could have built 3 major product features. We extracted the first service before the monolith was actually the constraint.
The second time, we waited for specific signals and moved only the components causing pain. The result was surgical, fast, and immediately beneficial.
The 7 Signals: When to Move
I track seven signals. When 4 or more are active simultaneously, it's time.
Signal 1: Deploy Coupling (Team Coordination Tax)
Measurement: How often does one team's deploy wait for another team's code to be ready?
## Deploy Coupling Score

Track over 4 weeks:
- Total deploys attempted: ___
- Deploys delayed by another team's unfinished work: ___
- Coupling ratio = delayed / total

Interpretation:
- < 10%: Monolith is fine. Coordinate better.
- 10-25%: Getting concerning. Monitor monthly.
- 25-50%: Active signal. Teams are blocking each other.
- > 50%: Critical. You're paying a massive coordination tax.
Our trigger: We hit 38% coupling when the payments team needed a hotfix but couldn't deploy because the search team had half-finished work on the same branch. The hotfix took 8 hours instead of 20 minutes.
Signal 2: Blast Radius of Changes
Measurement: What percentage of tests break when you change code in one domain?
// blast-radius-tracker.ts - Run after every PR
interface BlastRadiusReport {
  filesChanged: string[];
  domain: string;             // What area the change targeted
  testsRun: number;
  testsFailed: number;
  failedInOtherDomains: number;  // Tests in unrelated areas that broke
  blastRadius: number;           // failedInOtherDomains / testsFailed
}

// Example output:
// Change in: src/payments/processors/stripe.ts
// Tests failed: 14
// Failed in other domains: 9 (search: 3, notifications: 4, analytics: 2)
// Blast radius: 64%
Signal threshold: When >40% of test failures from a domain change are in OTHER domains, the code is too coupled.
Our trigger: A change to the user profile serialization format broke tests in payments, search, and notifications because they all directly accessed the user model with assumptions about its shape.
Signal 3: Build/Test Time
Measurement: CI pipeline duration trend over 3 months.
| Month | Build Time | Test Time | Total CI | Impact |
|---|---|---|---|---|
| January | 3 min | 8 min | 11 min | Acceptable |
| February | 4 min | 12 min | 16 min | Annoying |
| March | 5 min | 18 min | 23 min | Painful |
| April | 6 min | 24 min | 30 min | Signal active |
Signal threshold: When CI exceeds 20 minutes and is growing >15% month-over-month. At 30+ minutes, engineers stop running tests locally and push "to see if it passes." Quality degrades.
Signal 4: Database Contention
Measurement: Connection pool saturation, lock wait times, and query queue depth.
-- Monitor connection pool usage over time
SELECT
  datname,
  numbackends as active_connections,
  (SELECT setting::int FROM pg_settings WHERE name = 'max_connections') as max_connections,
  ROUND(numbackends::numeric / (SELECT setting::int FROM pg_settings WHERE name = 'max_connections') * 100, 1) as utilization_pct
FROM pg_stat_database
WHERE datname = 'production';

-- Monitor lock contention
SELECT
  COUNT(*) as waiting_queries,
  MAX(EXTRACT(EPOCH FROM (now() - query_start))) as max_wait_seconds
FROM pg_stat_activity
WHERE wait_event_type = 'Lock';
Signal threshold: Connection pool regularly >70% utilized, OR lock waits >1 second for >5% of queries. Different domains competing for the same database connections means they need separate data stores.
Signal 5: Team Ownership Ambiguity
Measurement: Who do you ask when [feature area] has a bug?
## Ownership Clarity Survey (ask each engineer)

For each module, rate clarity of ownership (1-5):
- User authentication: ___
- Payment processing: ___
- Search and recommendations: ___
- Notification system: ___
- Billing and subscriptions: ___
- Analytics pipeline: ___

Interpretation:
- Average > 4.0: Clear ownership. Monolith is fine.
- Average 3.0-4.0: Starting to blur. Consider boundaries.
- Average < 3.0: Active signal. Nobody knows who owns what.
Our trigger: We asked 12 engineers "who owns the notification system?" and got 5 different answers. When ownership is unclear, bugs live longer and quality degrades.
Signal 6: Scaling Heterogeneity
Measurement: Do different parts of the system need fundamentally different scaling characteristics?
| Component | Traffic Pattern | CPU Profile | Memory Profile | Scaling Need |
|---|---|---|---|---|
| API endpoints | Bursty, user-driven | Low per request | Low | Scale quickly to 0 |
| Payment processing | Steady, predictable | Medium | Medium | Always-on, reliable |
| Search indexing | Batch, periodic | High (CPU-bound) | High | Scale for batch windows |
| Real-time notifications | Event-driven spikes | Low | High (WebSocket connections) | Connection-count based |
| ML inference | Bursty, GPU-dependent | GPU-intensive | Very high | GPU-specific scaling |
Signal threshold: When you need 3+ different scaling strategies and the monolith forces you to scale everything together. If you're scaling 32GB RAM instances because the search component needs memory but the API component only needs CPU, you're wasting money.
Signal 7: Incident Correlation Across Domains
Measurement: Do incidents in one domain cause cascading failures in unrelated domains?
## Incident Cascade Analysis (last 3 months)

Incident 1: Payment processor timeout
  - Direct impact: Payments
  - Cascading impact: API latency +400%, search degraded
  - Cascade cause: Shared connection pool exhausted

Incident 2: Search re-indexing spike
  - Direct impact: Search
  - Cascading impact: All API endpoints slowed 3×
  - Cascade cause: Shared CPU on monolith instances

Incident 3: Notification queue backup
  - Direct impact: Notifications
  - Cascading impact: User signup flow timed out
  - Cascade cause: Shared event loop blocked
Signal threshold: When >50% of incidents cascade to unrelated domains. This means the monolith's shared resources create failure coupling that independent services would prevent.
The Signal Dashboard
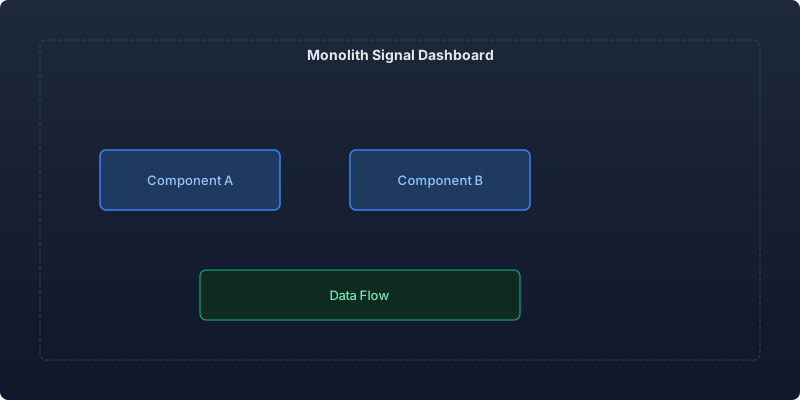
Track all 7 signals monthly. When 4+ are active simultaneously for 2+ consecutive months, begin extraction planning.
| Signal | Jan | Feb | Mar | Apr | May (Decision) |
|---|---|---|---|---|---|
| Deploy coupling | 🟢 | 🟡 | 🟡 | 🔴 | 🔴 |
| Blast radius | 🟢 | 🟢 | 🟡 | 🟡 | 🔴 |
| Build/test time | 🟢 | 🟢 | 🟡 | 🟡 | 🔴 |
| DB contention | 🟢 | 🟢 | 🟢 | 🟡 | 🟡 |
| Ownership ambiguity | 🟢 | 🟡 | 🟡 | 🔴 | 🔴 |
| Scaling heterogeneity | 🟢 | 🟢 | 🟡 | 🔴 | 🔴 |
| Incident cascading | 🟢 | 🟢 | 🟢 | 🟡 | 🟡 |
| Active signals | 0 | 0 | 0 | 2 | 4 ← trigger |
The Extraction Sequence
When signals trigger, don't extract everything at once. Follow this sequence:
Phase 1: Extract the Loudest Pain (4-6 weeks)
Pick the single component causing the most operational pain. For us, it was the payment processing module — it had the highest incident rate AND the strictest reliability requirements.
// Step 1: Define the service boundary
interface PaymentService {
  // All operations the monolith currently calls
  createPaymentIntent(order: Order): Promise<PaymentIntent>;
  processWebhook(event: StripeEvent): Promise<void>;
  refundPayment(paymentId: string, amount: number): Promise<Refund>;
  getPaymentStatus(paymentId: string): Promise<PaymentStatus>;
}

// Step 2: Create an internal interface in the monolith
// that mirrors the future service contract
class PaymentServiceClient implements PaymentService {
  constructor(
    private readonly mode: 'internal' | 'external',
    private readonly httpClient?: HttpClient,
  ) {}

  async createPaymentIntent(order: Order): Promise<PaymentIntent> {
    if (this.mode === 'internal') {
      // Call the local module (current behavior)
      return localPaymentModule.createIntent(order);
    }
    // Call the extracted service (future behavior)
    return this.httpClient!.post('/payments/intents', { order });
  }
}
Phase 2: Prove the Pattern (2-4 weeks)
Run the extracted service alongside the monolith. Measure:
- Latency impact of network hop
- Reliability of the new service independently
- Operational burden (deployment, monitoring, debugging)
- Team velocity improvement (can the payments team deploy independently?)
Phase 3: Extract the Next Candidate (4-6 weeks)
With the pattern proven, extract the second service. Each subsequent extraction is faster because infrastructure (API gateway, service discovery, shared auth) already exists.
Our extraction sequence:
- Payments (highest reliability need, clearest boundary)
- Search (highest resource need, different scaling pattern)
- Notifications (different scaling, async-only, easy to isolate)
- User management (shared dependency — extracted last because everything depends on it)
What to Keep in the Monolith
Not everything should be extracted. Keep these in the monolith:
- Code that's changing rapidly — if a module is being actively iterated, extraction freezes the API surface and slows iteration
- Tightly coupled business logic — if two domains can't function without synchronous calls between them, separating creates a distributed monolith (worse than a real monolith)
- Low-traffic components — if it's not causing pain and doesn't need independent scaling, leave it alone
- Cross-cutting concerns — auth, logging, and metrics should be shared libraries, not independent services
Key Takeaways
-
Wait for signals, not opinions — "the monolith feels slow" is not a signal. Deploy coupling >25%, blast radius >40%, and CI >20 minutes are signals. Measure them.
-
4+ simultaneous signals for 2+ months is the trigger — individual signals can be addressed within the monolith. Compound signals indicate systemic pressure.
-
Extract the loudest pain first — not the easiest module. The highest-pain extraction delivers immediate team relief and proves the pattern.
-
The Strangler Fig approach is mandatory — never rewrite the monolith. Extract services behind interfaces, run in parallel, migrate gradually.
-
Each extraction should take 4-6 weeks — if you're estimating 3+ months for a single service extraction, your boundaries are wrong. Rethink the cut.
-
Not everything needs extracting — the goal is NOT microservices. The goal is independent deployability for the components causing team friction. A modular monolith with 3 extracted services often beats a full microservices architecture.
The right time to break the monolith is when the monolith is costing you more than the complexity of distributed systems would. That's a measurable threshold, not a philosophical position. Measure it.
Recommended reading

Why the Gulf Will Produce the Next Wave of Logistics Tech Unicorns
Capital, demographics, infrastructure, and regulation are converging in the GCC. A thesis from inside a Qatari delivery platform doing 16M orders a year.
Post-Acquisition Technical Integration Playbook
How CTOs navigate the technical integration process after an acquisition, from day-one decisions through full platform consolidation
Landing Your First Enterprise Customer as a Startup: The Technical Credibility Playbook
A tactical guide for startup CTOs navigating enterprise sales cycles, from security questionnaires to architecture reviews, with timelines and preparation checklists.



Comments
No comments yet. Be the first to share your thoughts.