AWS Timestream for IoT: Time-Series Analytics at 50K Device Scale
Architecting a Timestream-based analytics pipeline for 50,000 IoT devices generating 500M data points daily — ingestion, querying, and cost optimization.

Managing time-series data from 50,000 IoT devices is a different engineering challenge than handling web application metrics. Each device reports telemetry every 5 seconds — temperature, pressure, vibration, and power consumption — generating 500 million data points daily. Traditional databases buckle under this write volume, and querying across temporal dimensions requires purpose-built storage.
This is how we built a Timestream-based analytics pipeline that ingests, stores, and queries IoT telemetry at scale while keeping costs under $8,000/month.
The Problem: RDS Couldn't Keep Up
Our initial architecture stored telemetry in PostgreSQL with TimescaleDB. It worked for 5,000 devices but degraded predictably as the fleet grew:
| Fleet Size | Write Throughput | Query Time (24h agg) | Storage Growth/Day | Monthly Cost |
|---|---|---|---|---|
| 5,000 | 10K writes/s | 1.2s | 8GB | $2,400 |
| 15,000 | 30K writes/s | 4.8s | 24GB | $5,800 |
| 30,000 | 60K writes/s | 18s (timeouts) | 48GB | $12,000+ |
| 50,000 | 100K writes/s | Failed | 80GB | Unsustainable |
At 30K devices, aggregation queries for dashboards started timing out. The storage growth rate meant we were spending more on disk than compute. We needed a time-series native solution.
Architecture: IoT Core to Timestream Pipeline
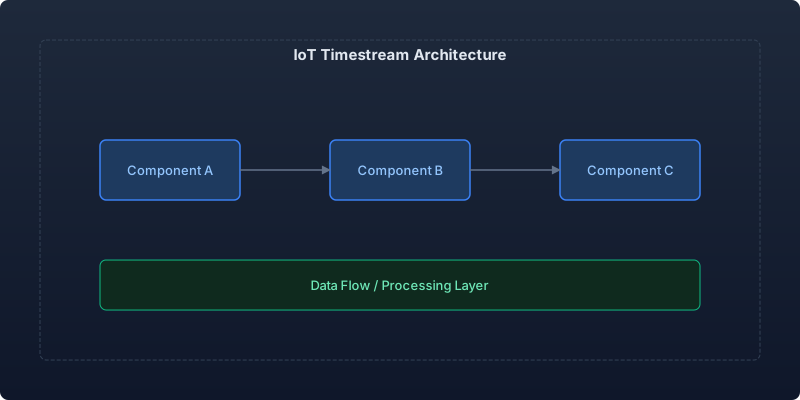
The pipeline flows from device firmware through AWS IoT Core, into Kinesis Data Streams for buffering, then into Timestream via a Lambda consumer. This decoupled architecture handles back-pressure gracefully and provides replay capability.
Device Telemetry Schema
// Device telemetry payload structure
interface DeviceTelemetry {
  deviceId: string;
  fleetId: string;
  timestamp: number;       // Unix epoch milliseconds
  metrics: {
    temperature: number;   // Celsius
    pressure: number;      // PSI
    vibration: number;     // mm/s RMS
    power: number;         // Watts
    humidity?: number;     // Percentage
    rpm?: number;          // Rotations per minute
  };
  metadata: {
    firmware: string;
    region: string;
    model: string;
  };
}

// Timestream record builder
function buildTimestreamRecords(telemetry: DeviceTelemetry): WriteRecordsCommandInput {
  const dimensions: Dimension[] = [
    { Name: 'device_id', Value: telemetry.deviceId },
    { Name: 'fleet_id', Value: telemetry.fleetId },
    { Name: 'region', Value: telemetry.metadata.region },
    { Name: 'model', Value: telemetry.metadata.model },
  ];

  const records: Record[] = Object.entries(telemetry.metrics)
    .filter(([_, value]) => value !== undefined)
    .map(([name, value]) => ({
      Dimensions: dimensions,
      MeasureName: name,
      MeasureValue: String(value),
      MeasureValueType: 'DOUBLE',
      Time: String(telemetry.timestamp),
      TimeUnit: 'MILLISECONDS',
    }));

  return {
    DatabaseName: 'iot_telemetry',
    TableName: 'device_metrics',
    Records: records,
    CommonAttributes: {
      Dimensions: dimensions,
      Time: String(telemetry.timestamp),
      TimeUnit: 'MILLISECONDS',
    },
  };
}
Kinesis to Timestream Lambda Consumer
import { TimestreamWriteClient, WriteRecordsCommand } from '@aws-sdk/client-timestream-write';
import { KinesisStreamEvent } from 'aws-lambda';

const client = new TimestreamWriteClient({ region: 'us-east-1' });

const BATCH_SIZE = 100; // Timestream max records per write

export const handler = async (event: KinesisStreamEvent): Promise<void> => {
  const records: Record[] = [];

  for (const record of event.Records) {
    const payload = JSON.parse(
      Buffer.from(record.kinesis.data, 'base64').toString()
    ) as DeviceTelemetry;

    const timestreamRecords = buildTimestreamRecords(payload);
    records.push(...timestreamRecords.Records!);
  }

  // Batch writes in chunks of 100
  for (let i = 0; i < records.length; i += BATCH_SIZE) {
    const batch = records.slice(i, i + BATCH_SIZE);
    try {
      await client.send(new WriteRecordsCommand({
        DatabaseName: 'iot_telemetry',
        TableName: 'device_metrics',
        Records: batch,
      }));
    } catch (error: any) {
      if (error.name === 'RejectedRecordsException') {
        // Handle rejected records (late-arriving data)
        console.error('Rejected records:', error.RejectedRecords);
        await writeToDeadLetterQueue(error.RejectedRecords);
      } else {
        throw error;
      }
    }
  }
};
Storage Tiers: Memory vs. Magnetic
Timestream's dual-tier storage is the key cost optimization lever. Recent data stays in memory for fast queries; historical data moves to magnetic storage automatically:
| Configuration | Memory Retention | Magnetic Retention | Cost Impact |
|---|---|---|---|
| Conservative | 24 hours | 1 year | Highest write cost |
| Balanced | 6 hours | 2 years | Optimal for dashboards |
| Cost-optimized | 1 hour | 5 years | Best for batch analytics |
We use the balanced configuration: 6 hours in memory covers real-time dashboards and alerting, while magnetic storage handles historical trend analysis at 1/10th the cost per GB.
Query Patterns and Performance
Real-Time Fleet Dashboard (Memory Tier)
-- Average temperature by region, last 30 minutes, 1-minute bins
SELECT
  region,
  bin(time, 1m) AS time_bucket,
  AVG(measure_value::double) AS avg_temperature,
  MAX(measure_value::double) AS max_temperature,
  COUNT(*) AS sample_count
FROM iot_telemetry.device_metrics
WHERE measure_name = 'temperature'
  AND time > ago(30m)
GROUP BY region, bin(time, 1m)
ORDER BY time_bucket DESC
Query time: 180ms across 50K devices.
Anomaly Detection (Cross-Tier)
-- Devices with temperature exceeding 2 standard deviations from their 7-day baseline
WITH baselines AS (
  SELECT
    device_id,
    AVG(measure_value::double) AS baseline_avg,
    STDDEV(measure_value::double) AS baseline_stddev
  FROM iot_telemetry.device_metrics
  WHERE measure_name = 'temperature'
    AND time BETWEEN ago(7d) AND ago(1h)
  GROUP BY device_id
),
current_readings AS (
  SELECT
    device_id,
    AVG(measure_value::double) AS current_avg
  FROM iot_telemetry.device_metrics
  WHERE measure_name = 'temperature'
    AND time > ago(15m)
  GROUP BY device_id
)
SELECT
  c.device_id,
  c.current_avg,
  b.baseline_avg,
  b.baseline_stddev,
  (c.current_avg - b.baseline_avg) / b.baseline_stddev AS z_score
FROM current_readings c
JOIN baselines b ON c.device_id = b.device_id
WHERE (c.current_avg - b.baseline_avg) / b.baseline_stddev > 2.0
ORDER BY z_score DESC
Query time: 2.4s — acceptable for scheduled anomaly checks every 5 minutes.
Cost Breakdown: 50K Devices
| Cost Component | Monthly Amount | Notes |
|---|---|---|
| Writes (memory) | $3,200 | 100K records/s × $0.50/million |
| Memory storage (6h) | $1,800 | ~180GB in-memory |
| Magnetic storage | $480 | 2TB @ $0.03/GB/month |
| Queries (memory) | $1,200 | Dashboard + alerting |
| Queries (magnetic) | $800 | Historical analytics |
| Total | $7,480/mo |
Compared to the PostgreSQL/TimescaleDB approach that was failing at $12,000/month for 30K devices, Timestream handles 50K devices for 38% less while maintaining query performance.
Operational Lessons
Late-arriving data requires planning. Timestream rejects writes with timestamps outside the memory store retention window. IoT devices go offline and batch-report when reconnected. We handle this with a separate "late arrivals" table with a 24-hour memory retention specifically for backfill scenarios.
Dimension cardinality affects cost. Each unique combination of dimensions creates a "time series" in Timestream. With 50K devices × 6 metrics, we have 300K time series — well within the scalable range. But adding high-cardinality dimensions (like request IDs) would explode costs.
Scheduled queries save money. For dashboards showing hourly/daily aggregates, Timestream Scheduled Queries pre-compute and store results. This reduced our query costs by 60% for historical views.
Key Takeaways
- Buffer before Timestream — Kinesis absorbs device spikes and provides replay for failures.
- Memory retention is your biggest cost lever — keep it as short as your real-time requirements allow.
- Design dimensions carefully — low cardinality dimensions only, use measure values for high-cardinality identifiers.
- Scheduled queries for historical dashboards — pre-compute aggregates instead of querying raw data repeatedly.
- Plan for late arrivals — IoT devices are unreliable, and rejected records mean data loss without a recovery strategy.
Timestream removed the operational burden of managing time-series infrastructure — no sharding decisions, no retention policy scripting, no capacity planning for write spikes. For IoT workloads above 10K devices, the managed service economics become compelling compared to self-managed alternatives.
Recommended reading

Per-Team Cost Allocation in Shared Kubernetes Clusters: From Chaos to Clarity
Implementing accurate per-namespace cost allocation in multi-tenant Kubernetes clusters, covering request vs. usage attribution, shared resource amortization, and building showback dashboards that drive accountability.

Measuring and Eliminating Toil: From 40% to 12% of Engineering Time
A systematic approach to identifying, measuring, and automating toil—the repetitive operational work that scales linearly with service growth and prevents engineers from doing creative work.

Serverless Postgres in Production: Branching, Scale-to-Zero, and the End of Database Provisioning
Running Neon serverless Postgres in production for 8 months — covering database branching workflows, scale-to-zero economics, connection pooling, and migration from RDS.



Comments
No comments yet. Be the first to share your thoughts.