Canary Deployments with Metrics-Driven Automated Rollback
Implementing canary analysis with automated rollback triggers using real-time metrics comparison between baseline and canary populations.

Canary deployments reduce blast radius by exposing new code to a small percentage of traffic before full rollout. But a canary without automated analysis is just a manual deployment with extra steps. The real value comes from statistical comparison between canary and baseline metrics, with automated rollback when degradation is detected.
We built a canary analysis system that catches 96% of production-impacting regressions before they affect more than 2% of users. Here is how it works.
The Problem: Human Judgment Does Not Scale
Before automated canary analysis, our deployment process looked like this:
- Deploy to canary (5% traffic)
- Engineer watches dashboards for 15 minutes
- If "nothing looks wrong," promote to full rollout
The failure modes were predictable:
- Fatigue: Engineers watching dashboards miss subtle degradation
- Baseline ambiguity: Is a 3ms latency increase signal or noise?
- Off-hours releases: Night deployments had no observers
- Delayed symptoms: Memory leaks and connection pool exhaustion manifest after 15 minutes
Result: 23% of production incidents originated from releases that passed manual canary observation.
Architecture: Statistical Canary Analysis
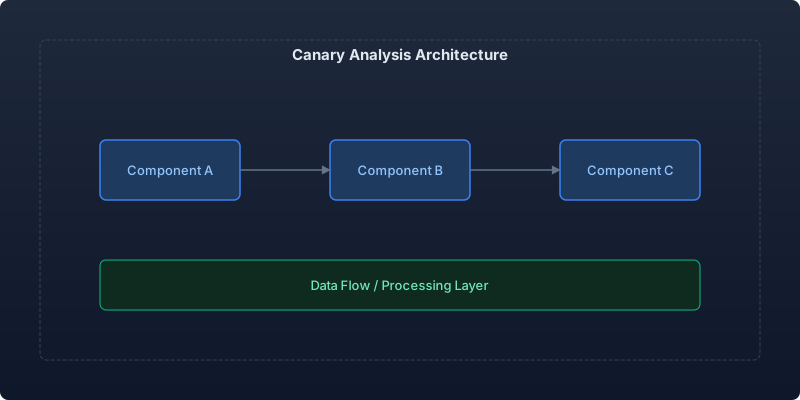
The system compares metrics from the canary population against a baseline population using statistical tests.
Traffic Splitting
We use weighted target groups in AWS ALB for precise traffic splitting:
# deployment/canary/alb.tf
resource "aws_lb_listener_rule" "canary_split" {
  listener_arn = aws_lb_listener.main.arn
  priority     = 100

  action {
    type = "forward"
    forward {
      target_group {
        arn    = aws_lb_target_group.baseline.arn
        weight = var.baseline_weight  # 95
      }
      target_group {
        arn    = aws_lb_target_group.canary.arn
        weight = var.canary_weight    # 5
      }
      stickiness {
        enabled  = true
        duration = 3600
      }
    }
  }
}
Metric Collection and Comparison
The canary analyzer collects time-series data from both populations and runs statistical tests:
// canary-analyzer/src/analyzer.ts
import { MetricsClient } from './metrics';
import { StatisticalTest, MannWhitneyU } from './statistics';

interface CanaryMetric {
  name: string;
  direction: 'lower_is_better' | 'higher_is_better';
  threshold: number;       // Maximum acceptable degradation percentage
  criticality: 'critical' | 'important' | 'informational';
}

interface CanaryVerdict {
  status: 'pass' | 'fail' | 'inconclusive';
  failedMetrics: MetricResult[];
  confidence: number;
  recommendation: 'promote' | 'rollback' | 'extend';
}

const CANARY_METRICS: CanaryMetric[] = [
  { name: 'http_request_duration_p99', direction: 'lower_is_better', threshold: 10, criticality: 'critical' },
  { name: 'http_request_duration_p50', direction: 'lower_is_better', threshold: 5, criticality: 'important' },
  { name: 'http_error_rate_5xx', direction: 'lower_is_better', threshold: 1, criticality: 'critical' },
  { name: 'http_error_rate_4xx', direction: 'lower_is_better', threshold: 15, criticality: 'informational' },
  { name: 'memory_usage_bytes', direction: 'lower_is_better', threshold: 20, criticality: 'important' },
  { name: 'cpu_usage_percent', direction: 'lower_is_better', threshold: 25, criticality: 'informational' },
  { name: 'db_connection_pool_exhaustion', direction: 'lower_is_better', threshold: 0, criticality: 'critical' },
];

class CanaryAnalyzer {
  private metrics: MetricsClient;
  private test: StatisticalTest;

  constructor(metricsClient: MetricsClient) {
    this.metrics = metricsClient;
    this.test = new MannWhitneyU({ significanceLevel: 0.05 });
  }

  async analyze(
    canaryTarget: string,
    baselineTarget: string,
    windowMinutes: number = 30
  ): Promise<CanaryVerdict> {
    const failedMetrics: MetricResult[] = [];
    let criticalFailure = false;

    for (const metric of CANARY_METRICS) {
      const [canaryData, baselineData] = await Promise.all([
        this.metrics.query(metric.name, canaryTarget, windowMinutes),
        this.metrics.query(metric.name, baselineTarget, windowMinutes),
      ]);

      if (canaryData.length < 30 || baselineData.length < 30) {
        continue; // Insufficient data for statistical significance
      }

      const result = this.test.compare(canaryData, baselineData);
      const degradation = this.calculateDegradation(canaryData, baselineData, metric.direction);

      if (result.significant && degradation > metric.threshold) {
        failedMetrics.push({
          metric: metric.name,
          degradation,
          pValue: result.pValue,
          criticality: metric.criticality,
        });
        if (metric.criticality === 'critical') {
          criticalFailure = true;
        }
      }
    }

    if (criticalFailure) {
      return { status: 'fail', failedMetrics, confidence: 0.95, recommendation: 'rollback' };
    }
    if (failedMetrics.length > 0) {
      return { status: 'fail', failedMetrics, confidence: 0.80, recommendation: 'rollback' };
    }
    return { status: 'pass', failedMetrics: [], confidence: 0.95, recommendation: 'promote' };
  }

  private calculateDegradation(canary: number[], baseline: number[], direction: string): number {
    const canaryMean = canary.reduce((a, b) => a + b, 0) / canary.length;
    const baselineMean = baseline.reduce((a, b) => a + b, 0) / baseline.length;

    if (direction === 'lower_is_better') {
      return ((canaryMean - baselineMean) / baselineMean) * 100;
    }
    return ((baselineMean - canaryMean) / baselineMean) * 100;
  }
}
Automated Rollback Orchestration
When the analyzer returns a rollback recommendation, the orchestrator acts immediately:
# canary-orchestrator/rollback.py
import boto3
from datetime import datetime

class CanaryRollbackOrchestrator:
    def __init__(self, service_name: str, cluster: str):
        self.ecs = boto3.client('ecs')
        self.service_name = service_name
        self.cluster = cluster
        self.sns = boto3.client('sns')

    async def execute_rollback(self, verdict: dict) -> None:
        rollback_start = datetime.utcnow()

        # Step 1: Shift all traffic to baseline immediately
        await self._set_traffic_weight(canary=0, baseline=100)

        # Step 2: Scale down canary task set
        await self._scale_canary(desired_count=0)

        # Step 3: Record rollback event
        rollback_duration = (datetime.utcnow() - rollback_start).total_seconds()
        await self._record_event({
            'service': self.service_name,
            'action': 'automatic_rollback',
            'trigger': verdict['failedMetrics'],
            'duration_seconds': rollback_duration,
            'confidence': verdict['confidence'],
            'timestamp': rollback_start.isoformat()
        })

        # Step 4: Notify team
        await self._notify(
            f"Canary ROLLBACK: {self.service_name}\n"
            f"Failed metrics: {[m['metric'] for m in verdict['failedMetrics']]}\n"
            f"Degradation: {[f\"{m['metric']}: +{m['degradation']:.1f}%\" for m in verdict['failedMetrics']]}\n"
            f"Rollback completed in {rollback_duration:.1f}s"
        )

    async def _set_traffic_weight(self, canary: int, baseline: int) -> None:
        self.ecs.update_service(
            cluster=self.cluster,
            service=self.service_name,
            taskSets=[
                {'taskSetId': 'baseline', 'scale': {'value': baseline, 'unit': 'PERCENT'}},
                {'taskSetId': 'canary', 'scale': {'value': canary, 'unit': 'PERCENT'}}
            ]
        )
Canary Analysis Timing
The analysis window matters. Too short and you miss slow-burn issues. Too long and you delay releases.
Our progressive analysis schedule:
| Time Window | Metrics Checked | Action on Failure |
|---|---|---|
| 0-5 min | Error rates, crash rate | Immediate rollback |
| 5-15 min | Latency P50/P99, throughput | Rollback if critical |
| 15-30 min | Memory growth, connection pools | Rollback |
| 30-60 min | Business metrics (conversion, revenue proxy) | Alert + manual decision |
Production Results
After 6 months of automated canary analysis:
| Metric | Before | After | Improvement |
|---|---|---|---|
| Incidents from releases | 4.6/month | 0.8/month | 83% reduction |
| Mean time to detect regression | 47 min | 4.2 min | 91% faster |
| Mean time to rollback | 12 min | 23 sec | 97% faster |
| User-facing impact duration | 59 min | 4.5 min | 92% reduction |
| False positive rate | N/A | 3.2% | Acceptable |
| Releases per day | 4 | 18 | 4.5x increase |
Handling Edge Cases
Insufficient Traffic
Low-traffic services cannot achieve statistical significance in reasonable timeframes. For services under 100 RPM, we use synthetic canary traffic:
# canary-config/low-traffic-service.yaml
canary:
  traffic_percentage: 50  # Higher split for low-traffic services
  analysis_window_minutes: 60
  synthetic_traffic:
    enabled: true
    requests_per_minute: 200
    scenarios:
      - name: core-user-flow
        weight: 60
      - name: edge-cases
        weight: 40
Canary with Feature Flags
When a canary tests a feature-flagged change, we correlate the canary metrics with flag exposure:
// Only analyze metrics from requests where the flag was evaluated
const canaryMetrics = await metrics.query(
  'http_request_duration_p99',
  canaryTarget,
  windowMinutes,
  { labels: { feature_flag: 'new-checkout-flow', flag_value: 'true' } }
);
Key Takeaways
-
Automate the judgment: Human observation of dashboards does not catch subtle regressions. Statistical comparison between canary and baseline populations does.
-
Define thresholds before deploying: Decide what constitutes unacceptable degradation for each metric before the canary starts. Post-hoc judgment introduces bias.
-
Progressive analysis windows: Check error rates immediately, latency after stabilization, and business metrics over longer windows.
-
Fast rollback is more important than fast promotion: Optimize your rollback path to sub-30 seconds. The canary is only useful if you can act on its signal before users notice.
-
Accept false positives as a cost: A 3% false positive rate means occasionally rolling back good releases. This is vastly preferable to a single bad release reaching 100% of users.
The canary system transformed our deployment culture from "deploy and hope" to "deploy and verify" — a prerequisite for shipping multiple times per day with confidence.
Recommended reading

Per-Team Cost Allocation in Shared Kubernetes Clusters: From Chaos to Clarity
Implementing accurate per-namespace cost allocation in multi-tenant Kubernetes clusters, covering request vs. usage attribution, shared resource amortization, and building showback dashboards that drive accountability.

Measuring and Eliminating Toil: From 40% to 12% of Engineering Time
A systematic approach to identifying, measuring, and automating toil—the repetitive operational work that scales linearly with service growth and prevents engineers from doing creative work.

Serverless Postgres in Production: Branching, Scale-to-Zero, and the End of Database Provisioning
Running Neon serverless Postgres in production for 8 months — covering database branching workflows, scale-to-zero economics, connection pooling, and migration from RDS.



Comments
No comments yet. Be the first to share your thoughts.