Distributed Tracing Across 47 Microservices with OpenTelemetry
How we implemented end-to-end distributed tracing with OpenTelemetry, reducing debugging time from hours to minutes across our service mesh

When a customer reports a slow checkout, and that request touches 47 microservices across three AWS regions, finding the bottleneck without distributed tracing is guesswork. We migrated from a patchwork of vendor-specific APM tools to a unified OpenTelemetry implementation that provides complete request lineage from edge to database. Here is how we instrumented 47 services in 12 weeks.
The Problem: Observability Fragmentation
Our observability stack had grown organically. The payments team used Datadog, the order team used New Relic, the inventory team used custom Prometheus exporters, and the platform team ran Jaeger for infrastructure traces. When a cross-team incident occurred, correlating signals required manual timestamp matching across four different UIs.
Pain points before OpenTelemetry:
- Average incident debugging time: 2.4 hours for cross-service issues
- 4 different tracing vendors with no context propagation between them
- 23% of traces were incomplete due to missing propagation headers
- No way to correlate a single customer request end-to-end
Architecture Design
We chose the OpenTelemetry Collector as our central pipeline, deployed as both a sidecar (for high-throughput services) and a gateway (for aggregation and export).
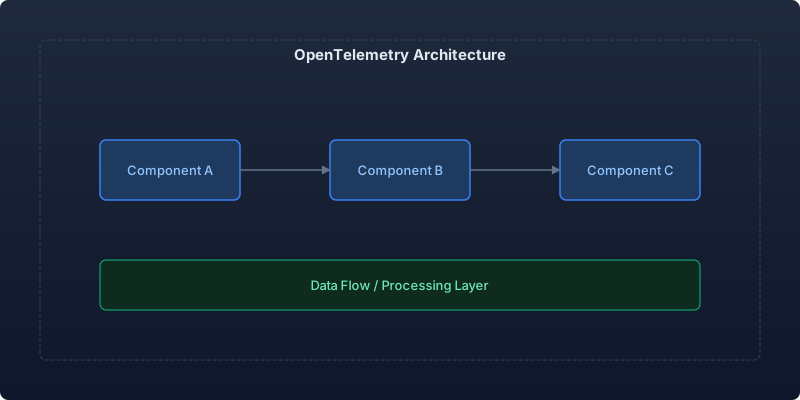
The architecture uses a two-tier collector deployment: sidecars handle local batching and initial processing, while gateway collectors perform tail-based sampling, service graph computation, and multi-backend export.
Instrumentation Strategy
We wrote a shared library that wraps OpenTelemetry initialization for all our Node.js and Python services. This ensured consistent configuration across teams.
import { NodeSDK } from '@opentelemetry/sdk-node';
import { OTLPTraceExporter } from '@opentelemetry/exporter-trace-otlp-grpc';
import { OTLPMetricExporter } from '@opentelemetry/exporter-metrics-otlp-grpc';
import { Resource } from '@opentelemetry/resources';
import { SemanticResourceAttributes } from '@opentelemetry/semantic-conventions';
import { BatchSpanProcessor } from '@opentelemetry/sdk-trace-base';
import { HttpInstrumentation } from '@opentelemetry/instrumentation-http';
import { ExpressInstrumentation } from '@opentelemetry/instrumentation-express';
import { PgInstrumentation } from '@opentelemetry/instrumentation-pg';
import { RedisInstrumentation } from '@opentelemetry/instrumentation-redis-4';

export function initTracing(serviceName: string) {
  const traceExporter = new OTLPTraceExporter({
    url: process.env.OTEL_COLLECTOR_ENDPOINT || 'grpc://otel-sidecar:4317',
  });

  const sdk = new NodeSDK({
    resource: new Resource({
      [SemanticResourceAttributes.SERVICE_NAME]: serviceName,
      [SemanticResourceAttributes.SERVICE_VERSION]: process.env.APP_VERSION || 'unknown',
      [SemanticResourceAttributes.DEPLOYMENT_ENVIRONMENT]: process.env.NODE_ENV || 'development',
      'service.team': process.env.TEAM_NAME || 'unknown',
      'service.tier': process.env.SERVICE_TIER || 'standard',
    }),
    spanProcessor: new BatchSpanProcessor(traceExporter, {
      maxQueueSize: 2048,
      maxExportBatchSize: 512,
      scheduledDelayMillis: 5000,
    }),
    instrumentations: [
      new HttpInstrumentation({
        ignoreIncomingPaths: ['/health', '/ready', '/metrics'],
      }),
      new ExpressInstrumentation(),
      new PgInstrumentation({ enhancedDatabaseReporting: true }),
      new RedisInstrumentation(),
    ],
  });

  sdk.start();
  return sdk;
}
This initialization runs before any other imports, ensuring all HTTP calls, database queries, and Redis operations are automatically captured.
OpenTelemetry Collector Configuration
The gateway collector configuration handles tail-based sampling, which was critical for our cost management. We only keep 100% of error traces and slow traces, while sampling 5% of successful fast traces.
receivers:
  otlp:
    protocols:
      grpc:
        endpoint: 0.0.0.0:4317
      http:
        endpoint: 0.0.0.0:4318

processors:
  tail_sampling:
    decision_wait: 10s
    num_traces: 100000
    expected_new_traces_per_sec: 5000
    policies:
      - name: errors-always
        type: status_code
        status_code:
          status_codes: [ERROR]
      - name: slow-traces
        type: latency
        latency:
          threshold_ms: 2000
      - name: probabilistic-sampling
        type: probabilistic
        probabilistic:
          sampling_percentage: 5

  batch:
    timeout: 5s
    send_batch_size: 1024
    send_batch_max_size: 2048

  resource:
    attributes:
      - key: collector.version
        value: "1.4.0"
        action: upsert

exporters:
  otlp/tempo:
    endpoint: tempo-distributor.observability:4317
    tls:
      insecure: false
      cert_file: /etc/ssl/certs/collector.pem

  prometheusremotewrite:
    endpoint: "http://mimir.observability:9009/api/v1/push"
    resource_to_telemetry_conversion:
      enabled: true

service:
  pipelines:
    traces:
      receivers: [otlp]
      processors: [tail_sampling, batch, resource]
      exporters: [otlp/tempo]
    metrics:
      receivers: [otlp]
      processors: [batch]
      exporters: [prometheusremotewrite]
Tail-based sampling at the gateway level reduced our trace storage costs by 72% while retaining 100% of actionable traces (errors and latency outliers).
Context Propagation Across Boundaries
The hardest part was not instrumentation but propagation. Our services communicate via HTTP, gRPC, SQS, and Kafka. Each required different propagation strategies.
For asynchronous messaging via SQS, we inject trace context into message attributes:
from opentelemetry import trace, context
from opentelemetry.propagate import inject
import json

def publish_to_sqs(queue_url: str, message_body: dict, tracer: trace.Tracer):
    with tracer.start_as_current_span(
        "sqs.publish",
        kind=trace.SpanKind.PRODUCER,
        attributes={
            "messaging.system": "aws_sqs",
            "messaging.destination": queue_url.split("/")[-1],
            "messaging.operation": "publish",
        }
    ) as span:
        # Inject trace context into message attributes
        carrier = {}
        inject(carrier)

        message_attributes = {
            key: {"DataType": "String", "StringValue": value}
            for key, value in carrier.items()
        }

        sqs_client.send_message(
            QueueUrl=queue_url,
            MessageBody=json.dumps(message_body),
            MessageAttributes=message_attributes,
        )

        span.set_attribute("messaging.message_id", response["MessageId"])
On the consumer side, we extract the context from message attributes and link it to the processing span. This gives us end-to-end traces even through asynchronous event-driven flows.
Service Dependency Graph
One unexpected benefit of full tracing was automatic service dependency mapping. We built a Grafana dashboard that renders real-time service graphs from trace data:
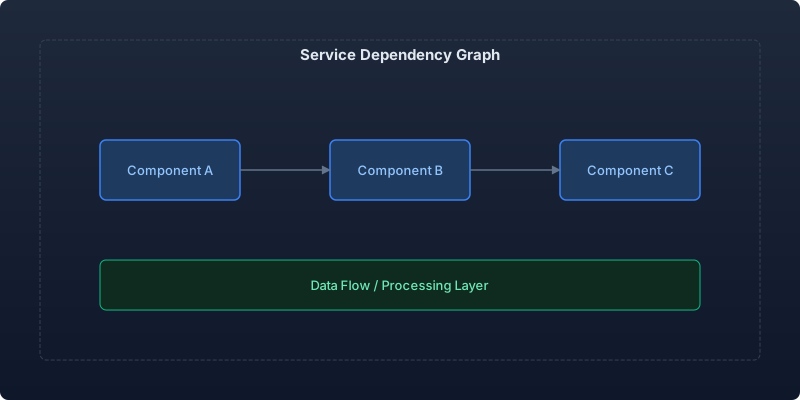
The graph updates every 30 seconds and highlights unhealthy edges (high error rates or elevated latency). During incidents, this became our primary navigation tool for identifying the blast radius.
Results After 12 Weeks
| Metric | Before | After | Improvement |
|---|---|---|---|
| Cross-service debugging time | 2.4 hours | 8 minutes | -94% |
| Trace completeness | 77% | 99.7% | +29% |
| Observability vendor cost | $18.4K/mo | $7.2K/mo | -61% |
| Services with tracing | 31/47 | 47/47 | 100% coverage |
| Context propagation gaps | 23% of traces | 0.3% of traces | -99% |
| Mean time to identify root cause | 47 minutes | 3.2 minutes | -93% |
The cost reduction came from consolidating four vendors into a self-hosted Grafana Tempo backend with tail-based sampling. We kept Grafana Cloud for dashboards and alerting.
Key Takeaways
Shared libraries beat documentation. Teams do not read instrumentation guides. A single initTracing(serviceName) call that auto-instruments everything achieved 100% adoption in four weeks.
Tail-based sampling is non-negotiable at scale. Head-based sampling at 5% would miss most error traces. Tail-based sampling at the collector level gave us 100% error capture with 95% cost reduction on normal traffic.
Async propagation is the real challenge. HTTP propagation works out of the box. SQS, Kafka, and SNS require custom propagation code. Budget twice the time for async boundaries.
Service graphs replace architecture diagrams. Our auto-generated dependency graph from trace data is always accurate, unlike manually maintained architecture documents that drift within weeks.
Conclusion
OpenTelemetry gave us what no single vendor could: unified, vendor-agnostic observability across 47 services, three regions, and four communication protocols. The 94% reduction in debugging time paid for the migration in the first month. Start with the shared instrumentation library, add tail-based sampling immediately, and tackle async propagation boundaries early. The hardest traces to complete are the most valuable ones to have.
Recommended reading

Per-Team Cost Allocation in Shared Kubernetes Clusters: From Chaos to Clarity
Implementing accurate per-namespace cost allocation in multi-tenant Kubernetes clusters, covering request vs. usage attribution, shared resource amortization, and building showback dashboards that drive accountability.

Measuring and Eliminating Toil: From 40% to 12% of Engineering Time
A systematic approach to identifying, measuring, and automating toil—the repetitive operational work that scales linearly with service growth and prevents engineers from doing creative work.

Serverless Postgres in Production: Branching, Scale-to-Zero, and the End of Database Provisioning
Running Neon serverless Postgres in production for 8 months — covering database branching workflows, scale-to-zero economics, connection pooling, and migration from RDS.



Comments
No comments yet. Be the first to share your thoughts.