GCP Dataflow Stream Processing Patterns: Windowing Strategies and Throughput Benchmarks
Production patterns for Apache Beam on Dataflow with windowing strategies, exactly-once semantics, and throughput benchmarks under varying data volumes.

Stream processing is deceptively simple in demos and relentlessly complex in production. After running 8 Dataflow streaming pipelines processing 4.2 billion events per day for our real-time analytics platform, I've identified the patterns that scale and the anti-patterns that collapse under load. This is the Dataflow production guide I wish existed when we started.
The Problem: Real-Time Analytics at Scale
Our platform ingests clickstream events, transaction signals, and IoT sensor data from 15M+ devices. Business requirements: compute aggregations with sub-minute freshness, handle late-arriving data gracefully, and maintain exactly-once processing guarantees — all while keeping costs predictable.
The challenge isn't building a streaming pipeline. It's building one that doesn't fall over when Black Friday traffic hits 12x normal volume.
Dataflow Streaming Architecture
Dataflow (backed by Apache Beam) provides a unified batch and streaming model with automatic scaling:
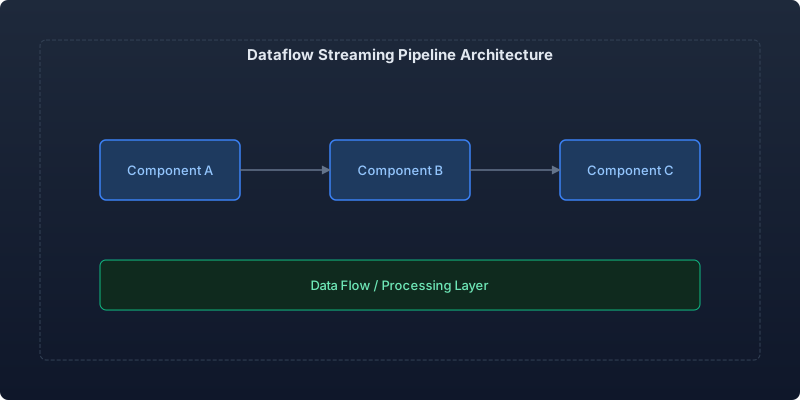
Key architectural concepts:
- Workers: Auto-scaling VMs that process data in parallel
- Watermark: Tracks data completeness — "all data up to time T has arrived"
- Windows: Time-based groupings for aggregation
- Triggers: When to emit results for a window
Windowing Strategy Comparison
We tested four windowing strategies on identical data:
| Strategy | Use Case | Latency | Completeness | Complexity |
|---|---|---|---|---|
| Fixed (tumbling) | Hourly reports | High (waits for window close) | Complete | Low |
| Sliding | Moving averages | Medium | Complete | Medium |
| Session | User activity | Variable | Per-session | High |
| Global + triggers | Real-time counters | Lowest | Partial | Medium |
Fixed Windows: The Foundation
Fixed windows are the workhorse for time-series aggregations:
import org.apache.beam.sdk.transforms.windowing.*;
import org.apache.beam.sdk.values.KV;

public class ClickstreamAggregation {

    public static PCollection<KV<String, Long>> aggregateByMinute(
            PCollection<ClickEvent> events) {

        return events
            // Apply 1-minute fixed windows
            .apply("Window", Window.<ClickEvent>into(
                FixedWindows.of(Duration.standardMinutes(1)))
                // Allow late data up to 5 minutes
                .withAllowedLateness(Duration.standardMinutes(5))
                // Accumulate late arrivals into existing panes
                .accumulatingFiredPanes()
                // Fire early results every 10 seconds
                .triggering(AfterWatermark.pastEndOfWindow()
                    .withEarlyFirings(
                        AfterProcessingTime.pastFirstElementInPane()
                            .plusDelayOf(Duration.standardSeconds(10)))
                    .withLateFirings(AfterPane.elementCountAtLeast(1)))
            )
            // Extract key (page_id) and count
            .apply("ExtractKey", MapElements.into(
                TypeDescriptors.kvs(TypeDescriptors.strings(), TypeDescriptors.longs()))
                .via(event -> KV.of(event.getPageId(), 1L)))
            .apply("Count", Sum.longsPerKey());
    }
}
Session Windows: User Activity Tracking
Session windows group events by activity gaps — ideal for user session analysis:
public class SessionAnalysis {

    public static PCollection<KV<String, SessionMetrics>> computeSessions(
            PCollection<UserEvent> events) {

        return events
            // Session window: gap of 30 minutes closes the session
            .apply("SessionWindow", Window.<UserEvent>into(
                Sessions.withGapDuration(Duration.standardMinutes(30)))
                .withAllowedLateness(Duration.standardHours(2))
                .accumulatingFiredPanes()
                .triggering(AfterWatermark.pastEndOfWindow()
                    .withEarlyFirings(
                        AfterProcessingTime.pastFirstElementInPane()
                            .plusDelayOf(Duration.standardMinutes(1))))
            )
            .apply("KeyByUser", WithKeys.of(UserEvent::getUserId))
            .apply("GroupByUser", GroupByKey.create())
            .apply("ComputeMetrics", ParDo.of(new DoFn<
                    KV<String, Iterable<UserEvent>>,
                    KV<String, SessionMetrics>>() {

                @ProcessElement
                public void process(ProcessContext c) {
                    String userId = c.element().getKey();
                    Iterable<UserEvent> sessionEvents = c.element().getValue();

                    SessionMetrics metrics = SessionMetrics.compute(sessionEvents);
                    c.output(KV.of(userId, metrics));
                }
            }));
    }
}
Throughput Benchmarks
We benchmarked Dataflow under controlled conditions with our production pipeline:
| Configuration | Throughput | Latency (p50) | Latency (p99) | Cost/hr |
|---|---|---|---|---|
| 5 workers (n1-standard-4) | 280K events/s | 4.2s | 12.8s | $1.05 |
| 10 workers (n1-standard-4) | 540K events/s | 3.1s | 8.4s | $2.10 |
| 20 workers (n1-standard-4) | 1.02M events/s | 2.8s | 7.1s | $4.20 |
| 10 workers (n1-standard-8) | 720K events/s | 2.4s | 6.2s | $2.80 |
| Auto-scaling (5-50 workers) | Up to 2.4M events/s | 3.8s avg | 15.2s burst | $3.20 avg |
Key findings:
- Throughput scales linearly up to ~20 workers, then sub-linearly due to shuffle overhead
- Latency is dominated by windowing/triggering, not processing
- Auto-scaling adds 2-3 minutes of response time during traffic spikes
Exactly-Once Processing
Dataflow provides exactly-once semantics for record processing, but the guarantee has boundaries:
public class ExactlyOnceSink extends DoFn<KV<String, Long>, Void> {

    // Dataflow guarantees each element is processed exactly once
    // But side effects (external writes) need idempotency

    @ProcessElement
    public void process(ProcessContext c) {
        String key = c.element().getKey();
        Long value = c.element().getValue();
        IntervalWindow window = (IntervalWindow) c.window();

        // Idempotent write: use window + key as deduplication identifier
        String deduplicationId = String.format("%s_%s_%d",
            key,
            window.start().toString(),
            window.end().toString()
        );

        // Write to BigQuery with deduplication
        bigQueryClient.insertRow(
            TableRow.builder()
                .set("metric_key", key)
                .set("metric_value", value)
                .set("window_start", window.start().getMillis())
                .set("window_end", window.end().getMillis())
                .set("dedup_id", deduplicationId)
                .build(),
            InsertOptions.builder()
                .setDeduplicationId(deduplicationId)
                .build()
        );
    }
}
Handling Late Data
Late-arriving data is the norm in distributed systems. Our strategy:
public class LateDataHandler {

    // Three-tier late data handling
    public static PCollectionTuple processWithLateData(
            PCollection<SensorReading> readings) {

        TupleTag<AggregatedReading> onTimeTag = new TupleTag<>("onTime");
        TupleTag<SensorReading> lateTag = new TupleTag<>("late");

        PCollectionTuple results = readings
            .apply("Window", Window.<SensorReading>into(
                FixedWindows.of(Duration.standardMinutes(5)))
                .withAllowedLateness(Duration.standardHours(1))
                .discardingFiredPanes()
                .triggering(AfterWatermark.pastEndOfWindow()
                    .withLateFirings(AfterPane.elementCountAtLeast(10))))
            .apply("ProcessWithSideOutputs", ParDo.of(
                new DoFn<SensorReading, AggregatedReading>() {

                    @ProcessElement
                    public void process(ProcessContext c, BoundedWindow window) {
                        Instant elementTime = c.element().getTimestamp();
                        Instant windowEnd = ((IntervalWindow) window).end();

                        if (elementTime.isBefore(windowEnd.minus(Duration.standardHours(1)))) {
                            // Extremely late: route to dead letter for manual review
                            c.output(lateTag, c.element());
                        } else {
                            // Within allowed lateness: process normally
                            c.output(aggregate(c.element()));
                        }
                    }
                }).withOutputTags(onTimeTag, TupleTagList.of(lateTag)));

        // Route extremely late data to a separate sink for analysis
        results.get(lateTag)
            .apply("WriteLateData", BigQueryIO.write()
                .to("project:dataset.late_arrivals")
                .withWriteDisposition(WriteDisposition.WRITE_APPEND));

        return results;
    }
}
Pipeline Deployment Configuration
# Deploy streaming pipeline with production settings
mvn compile exec:java \
  -Dexec.mainClass=com.example.StreamingPipeline \
  -Dexec.args=" \
    --project=analytics-prod \
    --region=us-central1 \
    --runner=DataflowRunner \
    --streaming=true \
    --jobName=clickstream-aggregation \
    --numWorkers=10 \
    --maxNumWorkers=50 \
    --autoscalingAlgorithm=THROUGHPUT_BASED \
    --workerMachineType=n1-standard-4 \
    --diskSizeGb=100 \
    --enableStreamingEngine \
    --experiments=enable_streaming_engine \
    --usePublicIps=false \
    --network=production-vpc \
    --subnetwork=regions/us-central1/subnetworks/dataflow-subnet"
The --enableStreamingEngine flag offloads shuffle operations to Google-managed infrastructure, reducing worker CPU by 30-40%.
Auto-Scaling Behavior
Dataflow's auto-scaling uses a throughput-based algorithm:
Target workers = max(
  backlog_time_seconds / target_backlog_seconds,
  current_throughput / (target_throughput_per_worker × 0.8)
)
We tuned the target backlog to 60 seconds — meaning Dataflow scales to ensure the backlog never exceeds 1 minute:
| Traffic Event | Workers Before | Workers After | Scale Time |
|---|---|---|---|
| Normal steady state | 10 | 10 | - |
| 2x traffic spike | 10 | 18 | 3.2 min |
| 5x traffic spike | 10 | 42 | 4.8 min |
| Traffic drop (return to normal) | 42 | 12 | 8.5 min |
| Black Friday (12x) | 10 | 50 (max) | 6.1 min |
Cost Optimization
Three strategies that reduced our streaming costs by 45%:
- Streaming Engine: Offloads shuffle to managed service, reducing worker count by 30%
- Right-sized workers: n1-standard-4 is optimal for our pipelines; larger machines waste memory
- Combiner optimization: Pre-aggregating before shuffle reduces data volume:
// Without combiner: every event shuffled individually
events.apply(GroupByKey.create()).apply(Sum.longsPerKey());

// With combiner: pre-aggregated locally before shuffle (4x less data shuffled)
events.apply(Combine.perKey(Sum.ofLongs()));
Key Takeaways
- Windowing + triggering is the hardest part. Get these wrong and you'll either have stale data or enormous costs from over-triggering.
- Enable Streaming Engine immediately. It's a free 30% cost reduction with zero behavior change.
- Auto-scaling has a 3-5 minute lag. For predictable spikes (marketing campaigns, batch imports), pre-scale workers manually.
- Late data is inevitable. Design for it with allowed lateness, accumulating panes, and dead letter sinks for extremely late data.
- Exactly-once applies to processing, not side effects. External writes (databases, APIs) still need idempotency keys.
- Monitor watermark lag. If your watermark falls behind, you're accumulating state and will eventually OOM. It's your most important streaming metric.
Dataflow abstracts enormous complexity, but production streaming still requires understanding the model deeply enough to tune windows, triggers, and scaling for your specific data characteristics.
Recommended reading

Per-Team Cost Allocation in Shared Kubernetes Clusters: From Chaos to Clarity
Implementing accurate per-namespace cost allocation in multi-tenant Kubernetes clusters, covering request vs. usage attribution, shared resource amortization, and building showback dashboards that drive accountability.

Measuring and Eliminating Toil: From 40% to 12% of Engineering Time
A systematic approach to identifying, measuring, and automating toil—the repetitive operational work that scales linearly with service growth and prevents engineers from doing creative work.

Serverless Postgres in Production: Branching, Scale-to-Zero, and the End of Database Provisioning
Running Neon serverless Postgres in production for 8 months — covering database branching workflows, scale-to-zero economics, connection pooling, and migration from RDS.



Comments
No comments yet. Be the first to share your thoughts.