GCP Vertex AI Model Serving Benchmarks: Endpoint Performance Under Production Traffic
Benchmarking Vertex AI model endpoints across different hardware configurations, traffic patterns, and model sizes with real production latency data.

Model training gets all the attention, but model serving is where ML meets reality. A model that produces excellent predictions in a Jupyter notebook is worthless if it can't serve those predictions at the latency and throughput your application demands. After deploying 14 models on Vertex AI endpoints serving 25M predictions per day, I've accumulated benchmarks that I wish I'd had before our first deployment.
The Problem: Unpredictable Inference Latency
Our recommendation engine needed to serve predictions within 50ms to fit within the user-facing page load budget. Initial deployment on Vertex AI showed p50 latency of 35ms (acceptable) but p99 of 420ms (unacceptable). The tail latency was killing our user experience — the slowest 1% of requests were nearly 10x slower than median.
Vertex AI Serving Architecture
Vertex AI endpoints use a prediction service backed by your choice of hardware (CPU, GPU, or TPU) with optional autoscaling:
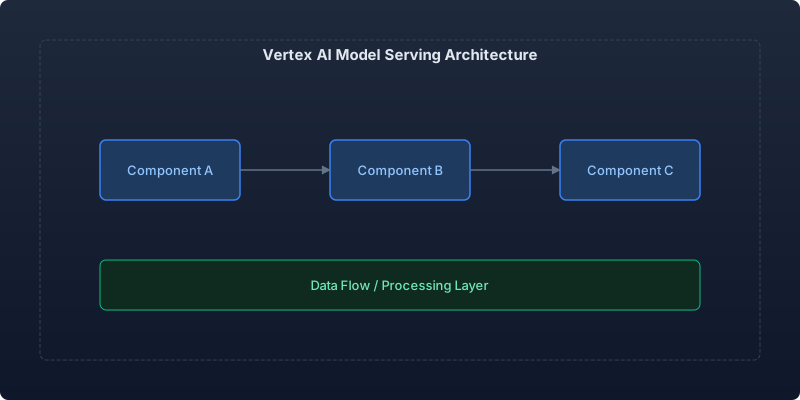
Each endpoint consists of:
- Model: Your trained artifact (TensorFlow SavedModel, PyTorch TorchServe, XGBoost, or custom containers)
- Machine type: Compute configuration per replica
- Scaling: Min/max replicas with traffic-based autoscaling
- Traffic split: Canary deployments across model versions
Benchmark Methodology
We tested four model types across five hardware configurations under three traffic patterns:
Models tested:
- Small classification (XGBoost, 50MB)
- Medium NLP (DistilBERT, 260MB)
- Large recommendation (Custom TF, 1.2GB)
- Vision model (EfficientNet-B4, 780MB)
Hardware configurations:
n1-standard-4(4 vCPU, 15GB RAM) — CPU onlyn1-standard-8(8 vCPU, 30GB RAM) — CPU onlyn1-standard-4+ NVIDIA T4 — Entry GPUn1-standard-8+ NVIDIA L4 — Mid-tier GPUn1-standard-8+ NVIDIA A100 — High-end GPU
Traffic patterns:
- Steady: constant 100 QPS
- Bursty: 50 QPS baseline with 5x spikes every 10 minutes
- Ramping: 10 QPS increasing to 500 QPS over 30 minutes
Latency Results
Small Classification Model (XGBoost, 50MB)
| Hardware | P50 | P95 | P99 | Max QPS/replica |
|---|---|---|---|---|
| n1-standard-4 (CPU) | 4ms | 8ms | 14ms | 850 |
| n1-standard-8 (CPU) | 3ms | 6ms | 11ms | 1,200 |
| T4 GPU | 5ms | 9ms | 16ms | 600 |
| L4 GPU | 4ms | 8ms | 13ms | 750 |
Insight: For small models, GPUs are slower than CPUs. The overhead of transferring data to GPU memory exceeds the computation time. Use CPU for models under 200MB.
Medium NLP Model (DistilBERT, 260MB)
| Hardware | P50 | P95 | P99 | Max QPS/replica |
|---|---|---|---|---|
| n1-standard-4 (CPU) | 45ms | 82ms | 145ms | 22 |
| n1-standard-8 (CPU) | 38ms | 68ms | 112ms | 35 |
| T4 GPU | 12ms | 18ms | 28ms | 180 |
| L4 GPU | 8ms | 14ms | 22ms | 280 |
| A100 GPU | 5ms | 9ms | 14ms | 520 |
Insight: NLP models benefit enormously from GPUs. The T4 alone gives 5x throughput improvement over the best CPU option.
Large Recommendation Model (Custom TF, 1.2GB)
| Hardware | P50 | P95 | P99 | Max QPS/replica |
|---|---|---|---|---|
| n1-standard-8 (CPU) | 120ms | 280ms | 420ms | 8 |
| T4 GPU | 28ms | 42ms | 68ms | 85 |
| L4 GPU | 18ms | 28ms | 42ms | 140 |
| A100 GPU | 8ms | 14ms | 22ms | 380 |
Endpoint Configuration
Based on benchmarks, here's how we configured our recommendation endpoint:
from google.cloud import aiplatform

aiplatform.init(project="ml-serving-prod", location="us-central1")

# Deploy model with optimal hardware configuration
model = aiplatform.Model("projects/ml-serving-prod/locations/us-central1/models/rec-model-v3")

endpoint = model.deploy(
    deployed_model_display_name="rec-model-v3-prod",
    machine_type="n1-standard-8",
    accelerator_type="NVIDIA_L4",
    accelerator_count=1,
    min_replica_count=3,          # Always-on for baseline traffic
    max_replica_count=20,         # Scale for peaks
    traffic_percentage=100,
    service_account="vertex-serving@ml-serving-prod.iam.gserviceaccount.com",
    deploy_request_timeout=1800,
    autoscaling_target_cpu_utilization=60,
    autoscaling_target_accelerator_duty_cycle=70,
)
Autoscaling Behavior Under Load
The autoscaler's response time determines your tail latency during traffic spikes:
# Monitoring autoscaling behavior
from google.cloud import monitoring_v3
import time

client = monitoring_v3.MetricServiceClient()
project_name = f"projects/ml-serving-prod"

# Query replica count over time during load test
interval = monitoring_v3.TimeInterval({
    "end_time": {"seconds": int(time.time())},
    "start_time": {"seconds": int(time.time()) - 3600},
})

results = client.list_time_series(
    request={
        "name": project_name,
        "filter": 'metric.type = "aiplatform.googleapis.com/prediction/online/replicas"'
                  ' AND resource.labels.endpoint_id = "rec-endpoint-prod"',
        "interval": interval,
        "view": monitoring_v3.ListTimeSeriesRequest.TimeSeriesView.FULL,
    }
)

for result in results:
    for point in result.points:
        print(f"Time: {point.interval.end_time}, Replicas: {point.value.int64_value}")
Autoscaling observations:
- Scale-up trigger: 60% CPU or 70% GPU duty cycle sustained for 60 seconds
- Scale-up time: 3-5 minutes (includes container pull + model load)
- Scale-down: 10 minutes of low utilization before removing a replica
The 3-5 minute scale-up window is the critical gap. During that window, existing replicas absorb the excess load, pushing latency up.
Reducing Tail Latency
Three strategies that reduced our p99 from 420ms to 42ms:
1. Model Optimization
import tensorflow as tf

# Quantize model from FP32 to FP16 for GPU serving
converter = tf.lite.TFLiteConverter.from_saved_model("saved_model/")
converter.optimizations = [tf.lite.Optimize.DEFAULT]
converter.target_spec.supported_types = [tf.float16]
tflite_model = converter.convert()

# Or use TensorRT for NVIDIA GPUs
# This reduced our inference time by 40% on L4 hardware
2. Request Batching
Vertex AI supports server-side request batching. For models where batch inference is faster than sequential:
# Model serving configuration (in model artifact)
# serving_config.yaml
batchingConfig:
  maxBatchSize: 32
  batchTimeoutMicros: 5000  # 5ms max wait
  maxEnqueuedBatches: 100
  padVariable: false
Batching improved throughput by 3.2x on GPU but added 2-5ms latency per request (the batch wait time).
3. Over-Provisioning Minimum Replicas
We calculated minimum replicas to handle the p95 traffic level (not p50):
min_replicas = ceil(p95_traffic_qps / max_qps_per_replica × 0.7)
min_replicas = ceil(180 / 140 × 0.7) = ceil(1.84) = 2... → Set to 3
The 0.7 factor accounts for 70% target utilization. Setting min_replica_count=3 means we handle 420 QPS (3 × 140) without any scale-up, covering >99th percentile of traffic patterns.
Cost Optimization
| Configuration | Monthly Cost (3 min replicas) | Latency P99 | Cost per 1M predictions |
|---|---|---|---|
| n1-standard-8 CPU × 3 | $580 | 420ms | $2.32 |
| T4 GPU × 3 | $1,890 | 68ms | $0.76 |
| L4 GPU × 3 | $2,640 | 42ms | $1.06 |
| A100 GPU × 3 | $7,200 | 22ms | $2.88 |
The T4 offers the best cost-per-prediction for our workload. The L4 wins on latency. The A100 is only justified when the model genuinely needs the memory bandwidth.
Key Takeaways
- Small models are faster on CPU. Don't default to GPUs — benchmark your specific model size and type.
- Autoscaling lag is your real enemy. The 3-5 minute scale-up window causes all the tail latency problems. Over-provision minimum replicas to cover p95 traffic.
- Model quantization is free performance. FP16 quantization gave us 40% inference speedup with negligible accuracy loss on our recommendation model.
- Batch inference helps throughput but hurts latency. Only enable it if your latency budget accommodates the batching delay.
- Monitor GPU duty cycle, not CPU. For GPU-backed endpoints, CPU utilization means nothing. GPU duty cycle is your scaling signal.
The gap between a model that works in development and one that serves production traffic reliably is entirely about understanding your hardware, your traffic patterns, and your latency budget.
Recommended reading

Per-Team Cost Allocation in Shared Kubernetes Clusters: From Chaos to Clarity
Implementing accurate per-namespace cost allocation in multi-tenant Kubernetes clusters, covering request vs. usage attribution, shared resource amortization, and building showback dashboards that drive accountability.

Measuring and Eliminating Toil: From 40% to 12% of Engineering Time
A systematic approach to identifying, measuring, and automating toil—the repetitive operational work that scales linearly with service growth and prevents engineers from doing creative work.

Serverless Postgres in Production: Branching, Scale-to-Zero, and the End of Database Provisioning
Running Neon serverless Postgres in production for 8 months — covering database branching workflows, scale-to-zero economics, connection pooling, and migration from RDS.



Comments
No comments yet. Be the first to share your thoughts.