Building an Internal Developer Portal That Reduced Deployment Friction by 70%
How we built an Internal Developer Platform using Backstage that cut deployment lead time from 45 minutes to 12 minutes and reduced onboarding time for new engineers by 60%.

Platform engineering is not about building infrastructure. It is about building the developer experience layer on top of infrastructure that makes the right thing the easy thing. When we started our platform engineering initiative, deploying a new microservice required 14 manual steps across 6 different tools, took 45 minutes on average, and had a 23% failure rate on first attempt. Twelve months later, the same deployment takes 12 minutes with a single command and fails less than 2% of the time.
This article covers how we built our Internal Developer Platform (IDP) using Backstage as the foundation, the organizational challenges that nearly killed the project, and the metrics that proved its value to skeptical leadership.
The Problem: Developer Friction at Scale
With 180 microservices and 85 engineers across 12 teams, we measured developer friction at every stage:
| Activity | Time Before IDP | Pain Points |
|---|---|---|
| Create new service | 4-6 hours | 14 manual steps, 6 tools, tribal knowledge |
| Deploy to production | 45 min avg | Pipeline configs, manual approvals, environment drift |
| Onboard new engineer | 3 weeks to first deploy | Documentation scattered across 8 wikis |
| Debug production issue | 25 min to find relevant logs | 4 observability tools, no service-to-service map |
| Request infrastructure | 2-5 days (ticket-based) | Ops team bottleneck, context switching |
The cumulative cost: we estimated 12,000 engineer-hours per year lost to infrastructure friction. At our loaded engineering cost, that is $2.4M annually — enough to fund the entire platform team twice over.
Architecture Overview
Our IDP is built on Backstage as the unified developer portal, with custom plugins connecting to our infrastructure, CI/CD, and observability stack.
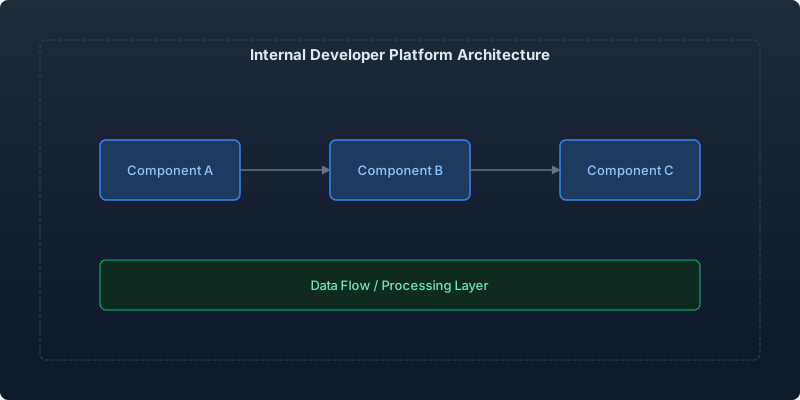
Core Components
Backstage Portal — The single entry point for all developer interactions. Service catalog, documentation, templates, and self-service infrastructure.
Service Templates — Golden paths for creating new services with production-ready defaults (CI/CD, monitoring, security scanning, documentation structure).
Infrastructure Automation Layer — Terraform modules exposed through Backstage scaffolder for self-service provisioning.
Observability Integration — Unified dashboards pulling from Datadog, PagerDuty, and deployment history into a single service view.
Backstage Customization
We run Backstage with 14 custom plugins. The most impactful are the service scaffolder, deployment dashboard, and infrastructure self-service.
Service Scaffolder Template
Our scaffolder creates a production-ready service in 12 minutes that previously took 4-6 hours of manual configuration:
# Backstage scaffolder template for new microservices
apiVersion: scaffolder.backstage.io/v1beta3
kind: Template
metadata:
  name: microservice-typescript
  title: TypeScript Microservice
  description: |
    Creates a production-ready TypeScript microservice with CI/CD,
    monitoring, and infrastructure provisioned automatically.
  tags:
    - typescript
    - microservice
    - recommended
spec:
  owner: platform-team
  type: service
  parameters:
    - title: Service Configuration
      required:
        - serviceName
        - team
        - description
      properties:
        serviceName:
          title: Service Name
          type: string
          pattern: '^[a-z][a-z0-9-]*$'
          maxLength: 40
          description: 'Lowercase, alphanumeric with hyphens (e.g., payment-processor)'
        team:
          title: Owning Team
          type: string
          enum: ['payments', 'accounts', 'notifications', 'analytics', 'platform']
        description:
          title: Description
          type: string
          maxLength: 200
        tier:
          title: Service Tier
          type: string
          enum: ['tier-0', 'tier-1', 'tier-2', 'tier-3']
          default: 'tier-2'
          description: 'Determines SLO targets and on-call requirements'
    - title: Infrastructure Requirements
      properties:
        database:
          title: Database
          type: string
          enum: ['none', 'postgresql', 'redis', 'dynamodb']
          default: 'postgresql'
        messaging:
          title: Message Queue
          type: string
          enum: ['none', 'sqs', 'kafka']
          default: 'none'
        scaling:
          title: Auto-scaling Configuration
          type: object
          properties:
            minInstances:
              type: integer
              default: 2
            maxInstances:
              type: integer
              default: 10
            targetCpu:
              type: integer
              default: 70

  steps:
    - id: generate
      name: Generate Service Scaffold
      action: fetch:template
      input:
        url: ./skeleton
        values:
          serviceName: ${{ parameters.serviceName }}
          team: ${{ parameters.team }}
          tier: ${{ parameters.tier }}
          database: ${{ parameters.database }}

    - id: create-repo
      name: Create GitHub Repository
      action: publish:github
      input:
        repoUrl: github.com?owner=org&repo=${{ parameters.serviceName }}
        defaultBranch: main
        protectDefaultBranch: true
        requiredApprovingReviewCount: 1

    - id: provision-infrastructure
      name: Provision Infrastructure
      action: custom:terraform-apply
      input:
        module: microservice-base
        variables:
          service_name: ${{ parameters.serviceName }}
          team: ${{ parameters.team }}
          tier: ${{ parameters.tier }}
          database_type: ${{ parameters.database }}
          messaging_type: ${{ parameters.messaging }}
          min_instances: ${{ parameters.scaling.minInstances }}
          max_instances: ${{ parameters.scaling.maxInstances }}

    - id: setup-monitoring
      name: Configure Monitoring
      action: custom:datadog-setup
      input:
        serviceName: ${{ parameters.serviceName }}
        tier: ${{ parameters.tier }}
        team: ${{ parameters.team }}

    - id: register-catalog
      name: Register in Service Catalog
      action: catalog:register
      input:
        repoContentsUrl: ${{ steps['create-repo'].output.repoContentsUrl }}
        catalogInfoPath: /catalog-info.yaml
Deployment Dashboard Plugin
Our custom deployment dashboard aggregates deployment status across all environments and surfaces deployment health metrics.
// Custom Backstage plugin: Deployment Dashboard
import { createPlugin, createRoutableExtension } from '@backstage/core-plugin-api';
import { rootRouteRef } from './routes';

export const deploymentDashboardPlugin = createPlugin({
  id: 'deployment-dashboard',
  routes: {
    root: rootRouteRef,
  },
});

// API client for deployment data
interface DeploymentMetrics {
  serviceName: string;
  environment: string;
  lastDeployment: {
    version: string;
    timestamp: string;
    duration: number;
    status: 'success' | 'failed' | 'rolling-back';
    author: string;
    commitSha: string;
  };
  deploymentFrequency: {
    daily: number;
    weekly: number;
    monthly: number;
  };
  changeFailureRate: number;
  meanTimeToRecovery: number;
  leadTimeForChanges: number;
}

// Deployment health scoring
function calculateDeploymentHealth(metrics: DeploymentMetrics): {
  score: number;
  level: 'elite' | 'high' | 'medium' | 'low';
  recommendations: string[];
} {
  let score = 100;
  const recommendations: string[] = [];

  // DORA metric: Deployment frequency
  if (metrics.deploymentFrequency.weekly < 1) {
    score -= 25;
    recommendations.push('Deploy more frequently — batch size correlates with risk');
  }

  // DORA metric: Change failure rate
  if (metrics.changeFailureRate > 0.15) {
    score -= 30;
    recommendations.push('High change failure rate — increase test coverage or add canary deployment');
  }

  // DORA metric: Mean time to recovery
  if (metrics.meanTimeToRecovery > 3600) {
    score -= 25;
    recommendations.push('MTTR exceeds 1 hour — implement automated rollback');
  }

  // DORA metric: Lead time for changes
  if (metrics.leadTimeForChanges > 86400) {
    score -= 20;
    recommendations.push('Lead time exceeds 1 day — reduce PR review queue');
  }

  const level = score >= 90 ? 'elite' : score >= 70 ? 'high' : score >= 50 ? 'medium' : 'low';
  return { score, level, recommendations };
}
Self-Service Infrastructure
The highest-impact feature of our IDP is self-service infrastructure provisioning. Engineers request databases, queues, and caches through the portal without filing tickets.
Before vs After
| Infrastructure Request | Before (Ticket) | After (Self-Service) |
|---|---|---|
| PostgreSQL database | 3-5 business days | 8 minutes |
| Redis cache cluster | 2-3 business days | 5 minutes |
| SQS queue with DLQ | 1-2 business days | 3 minutes |
| Kafka topic | 3-5 business days | 6 minutes |
| S3 bucket with policy | 1-2 business days | 2 minutes |
The provisioning time reduction is dramatic, but the hidden benefit is even larger: engineers no longer context-switch away from their feature work to wait for infrastructure. The cognitive overhead of tracking a ticket, following up, and resuming work after days of delay is eliminated.
Measuring Platform Success
We track platform adoption and impact through four key dimensions:
Developer Experience Metrics
| Metric | Before IDP | After IDP (12 months) | Improvement |
|---|---|---|---|
| Time to first deploy (new engineer) | 15 days | 6 days | 60% faster |
| Service creation time | 4-6 hours | 12 minutes | 96% faster |
| Deployment lead time | 45 minutes | 12 minutes | 73% faster |
| Deployment failure rate | 23% | 1.8% | 92% reduction |
| Infrastructure request fulfillment | 3.2 days | 6 minutes | 99.9% faster |
| Developer satisfaction score (1-10) | 4.2 | 7.8 | +86% |
Platform Adoption
| Month | Services Using Templates | Self-Service Provisioning | Portal Active Users |
|---|---|---|---|
| Month 1 | 3 (pilot) | 0 | 12 |
| Month 3 | 18 | 24 requests | 34 |
| Month 6 | 67 | 156 requests/month | 62 |
| Month 9 | 124 | 340 requests/month | 78 |
| Month 12 | 168 (93%) | 520 requests/month | 83 (98%) |
Organizational Challenges
The technical implementation was the easy part. The organizational challenges nearly killed the project:
Challenge 1: The "not my workflow" resistance. Teams with existing automation were reluctant to migrate. We solved this by supporting their existing tools as plugins in the portal rather than forcing migration. Adoption followed naturally once they saw the unified view.
Challenge 2: Platform team as bottleneck. Initially, every customization request came to our 4-person platform team. We solved this by making Backstage plugins self-serviceable — teams can build and deploy their own plugins following our template.
Challenge 3: Proving ROI to leadership. "Developer experience" is fuzzy to executives. We reframed every metric in terms of engineering capacity recovered. "12,000 hours saved annually" resonates better than "improved developer experience."
Challenge 4: Golden path vs. prison. Engineers feared losing flexibility. We designed golden paths as "paved roads" — the default choice that works 90% of the time, with explicit escape hatches for the 10% that need custom solutions. No enforcement, only incentives.
Golden Path Design Principles
Our golden paths follow four principles:
- Opinionated by default, flexible by exception. The template makes the recommended choice. Engineers can override, but must document why.
- Production-ready from minute one. Every scaffolded service ships with monitoring, alerting, CI/CD, and security scanning. Zero additional configuration for production deployment.
- Self-documenting. The template generates documentation, ADRs (Architecture Decision Records), and runbooks alongside the code.
- Evolvable. Templates version independently. Existing services can upgrade to newer template versions through automated migration PRs.
Conclusion
Platform engineering is a product discipline applied to internal tools. The IDP is your product; your engineers are your users. Apply the same rigor to developer experience research, adoption metrics, and iterative improvement that product teams apply to customer-facing products.
The 70% reduction in deployment friction was not achieved through a single technical innovation. It came from systematically identifying every friction point in the developer workflow and building opinionated defaults that eliminate decisions. Engineers should think about their domain logic, not about Terraform modules, Helm charts, or Datadog dashboard configurations.
Start small. Pick the single highest-friction workflow (usually service creation or environment provisioning), build the golden path for that one workflow, and prove the model works. Expansion will be pulled by demand, not pushed by the platform team. The best platform engineering work creates demand for itself.
Recommended reading

Per-Team Cost Allocation in Shared Kubernetes Clusters: From Chaos to Clarity
Implementing accurate per-namespace cost allocation in multi-tenant Kubernetes clusters, covering request vs. usage attribution, shared resource amortization, and building showback dashboards that drive accountability.

Measuring and Eliminating Toil: From 40% to 12% of Engineering Time
A systematic approach to identifying, measuring, and automating toil—the repetitive operational work that scales linearly with service growth and prevents engineers from doing creative work.

Serverless Postgres in Production: Branching, Scale-to-Zero, and the End of Database Provisioning
Running Neon serverless Postgres in production for 8 months — covering database branching workflows, scale-to-zero economics, connection pooling, and migration from RDS.



Comments
No comments yet. Be the first to share your thoughts.